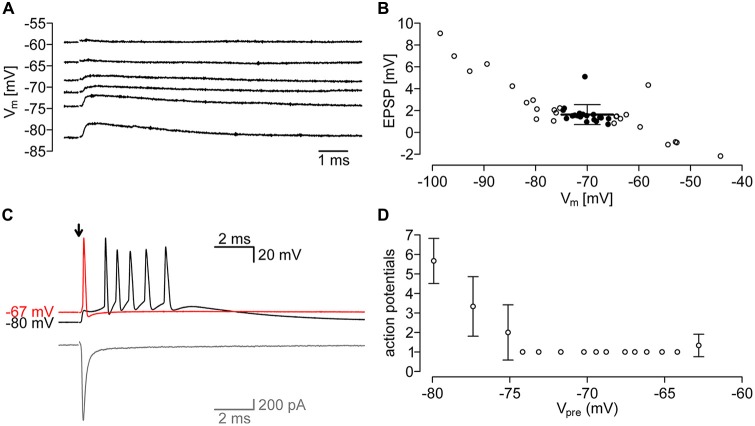
Figure 6.
Evoked postsynaptic potentials of the PIR-MD Synapses. (A) Example traces of EPSPs at different membrane potentials. (B) Quantification of EPSPs at various membrane potentials. Emphasis is laid on EPSP in the range of −75 mV, to −65 mV (filled circles). The average EPSP in that range is 1.63 ± 0.91 mV. (C) Example trace of action potentials (APs) evoked through synaptic stimulation at membrane potentials of −80 mV and −67 mV. In gray the corresponding current trace. (D) At lower membrane potentials (−75 mV) the number of APs in the AP-burst is dependent on the membrane potential (n = 3 stimuli at each potential).

