
Figure 1.
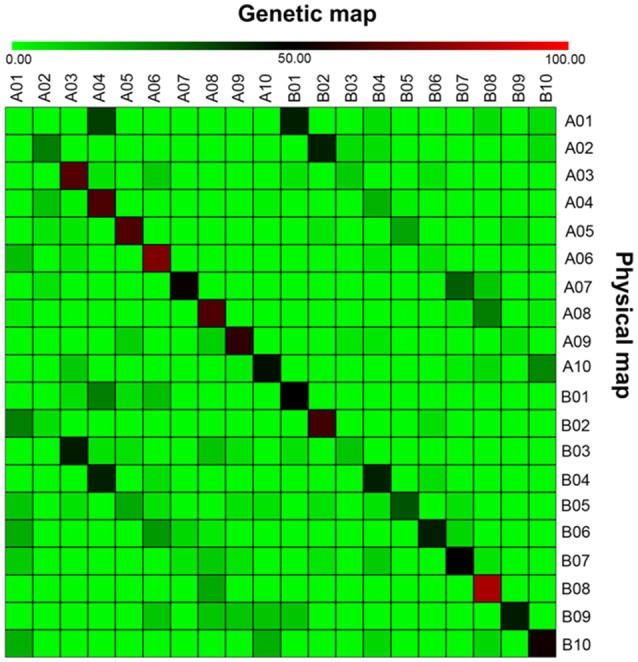
Genome-wide comparison of mapped markers on the T-population genetic map with the physical map of sub-genomes of the two diploid ancestors of cultivated peanut. The physical map of the pseudomolecules A01–A10 are from Arachis duranensis while the pseudomolecules B01–B10 are from A. ipaensis. The linkage groups A01–A10 of genetic map are that from A. duranensis while that from B01–B10 of A. ipaensis. Gradient color denotes percent similarity between the marker locations in genetic map compared with that of the physical map. The light green color denotes 0% similarity, i.e., no marker in common between that linkage groups and the corresponding pseudomolecules, while red color denotes 100% similarity, i.e., all the markers on a particular linkage group of genetic map were also present on corresponding pseudomolecules of the physical map.