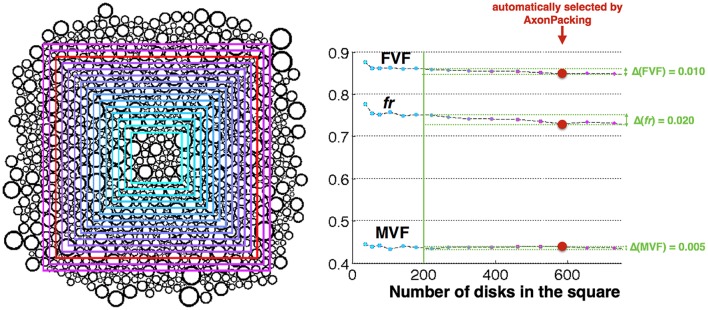
Figure 5.
Effect of the number of axons in the area. Left Result of the simulation and areas Atot where the statistics are computed. The size of the area is color-coded from cyan (smallest) to purple (biggest). The area automatically selected by AxonPacking is colored in red. Right FVF, fr and MVF values in the different areas (same color-coding), and measured errors (light green).

