FIGURE 2.
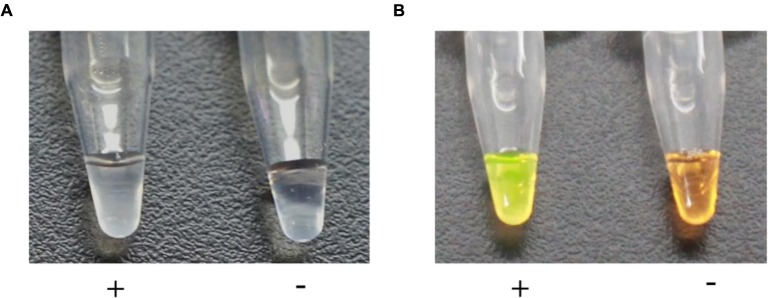
Visual assessment of DNA amplification by LAMP. (A) The turbidity indicating a positive reaction (+) was caused by the magnesium pyrophosphate precipitate produced during DNA synthesis, whereas the negative control (-) remained clear. (B) The solution turned green (+) in the presence of a LAMP amplification, while it remained orange (-) with no amplification.

