Figure 3.
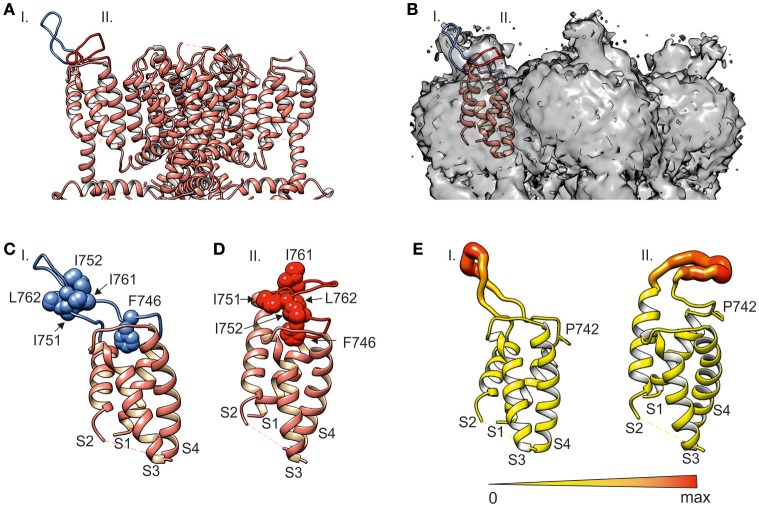
MD simulations of S1–S4 sensor module (i.e., amino acids S725-L850) reveal two distinct conformations stabilized by hydrophobic interactions. (A) Ribbon diagram of the transmembrane domain (i.e., amino acids N722 to A971) of human TRPA1 channel with two predicted S1–S2 linker conformations (I and II, blue and red) added to TRPA1 structure 3J9P (Paulsen et al., 2015, depicted in salmon color). (B) Electron density map EMD-6267 of TRPA1 superimposed on the S1–S4 sensor domain and two predicted S1–S2 linker conformations I and II (blue and red). (C,D) Details of the S1–S4 sensor domain shown in (A). (C) Conformation I (blue) represents the stable hairpin stabilized by hydrophobic residues. (D) Conformation II (red) interacts with the upper part of the sensor module via hydrophobic residues. Phenylalanine F746 is situated in the middle of the upper part of the S1–S4 sensor domain. (E) The extent of S1–S2 linker flexibility for both conformations represented as a putty representation of the protein colored according to average B-factor was prepared in Chimera using the Render by Attribute menu under Tools and Structure Analysis menu. The diameter and color of the S1–S2 linker are scaled to the maximum B-factor. Orange to red colors and a wider tube indicate a region with a higher average B-factor, whereas shades of yellow and a narrower tube represent a region with a lower average B-factor. Proline P742 at the beginning of the S1–S2 linker is shown.

