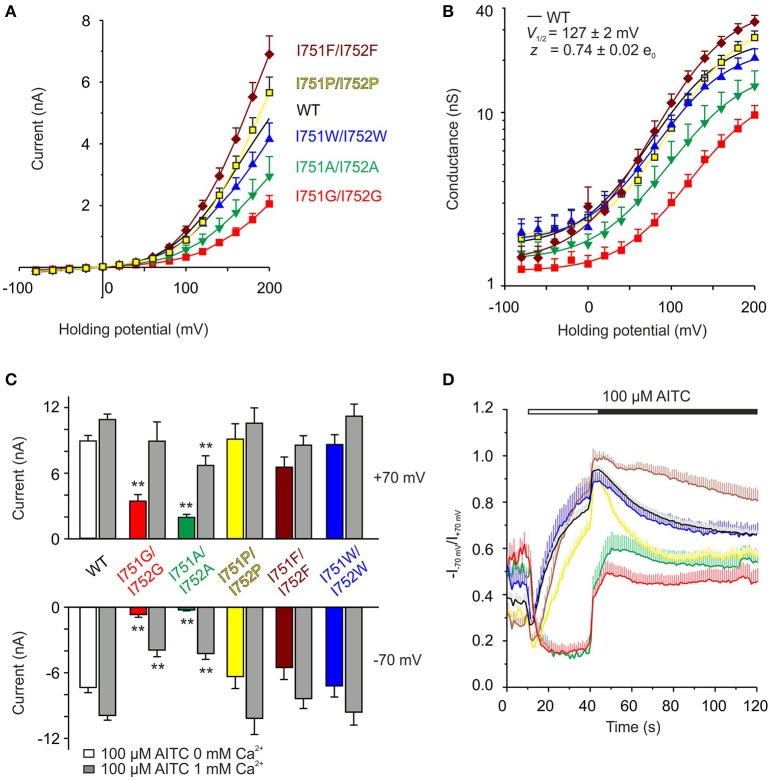
Figure 6.
The precise size and hydrophobicity of amino acids at position of isoleucines 751 and 752 are critical parameters for the voltage activation of TRPA1. (A) Average current-voltage relationships of wild type (WT, n = 121) shown as a black line and indicated double mutants of isoleucines shown as colored curves (I751A/I752A, n = 22, green; I751G/I752G, n = 31, red; I751P/I752P, n = 25, yellow; I751F/I752F, n = 17, brown; I751W/I752W, n = 24, blue) obtained from steady-state of current responses induced by voltage protocol as in Figure 4A (100 ms voltage steps from −80 mV to +200 mV, holding potential −70 mV; increment 20 mV), measured in extracellular control solution. Data are presented as mean ± SEM. (B) Average conductances of individual double mutants and WT obtained as in A from voltage-step protocols (see Figure 4A) using equation G = I/(V-Vrev), fitted as in Figure 4B. V1/2 = 146.1 ± 3.1 mV, z = 0.81 ± 0.04 e0 for I751P/I752P, V1/2 = 149.4 ± 3.4 mV, z = 0.75 ± 0.04 e0 for I751F/I752F, and V1/2 = 123.5 ± 5.3 mV, z = 0.78 ± 0.06 e0 for I751W/I752W. Colors as in (A). (C) Summary graph of maximum AITC currents of wild type (WT, n = 63) and isoleucine double mutants (I751A/I752A, n = 11; I751G/I752G, n = 8; I751P/I752P, n = 12; I751F/I752F, n = 10 and I751W/I752W, n = 10) from experiment as in Figure 5A, in the absence of Ca2+ (colored bars) and in the presence of 1 mM Ca2+ (peak, gray bars), measured at +70 mV and −70 mV. The asterisks indicate a significant difference from wild-type TRPA1, **p < 0.001. (D) Average changes in rectification ratio (R = −I−70mV/I+70mV) for wild-type TRPA1 (black line) and indicated double mutants, colored as in (A). The applications of AITC without Ca2+ (white horizontal bar) and in the presence of 1 mM Ca2+ (black horizontal bar) are indicated above. Data represent mean ± SEM, n as in (C).

