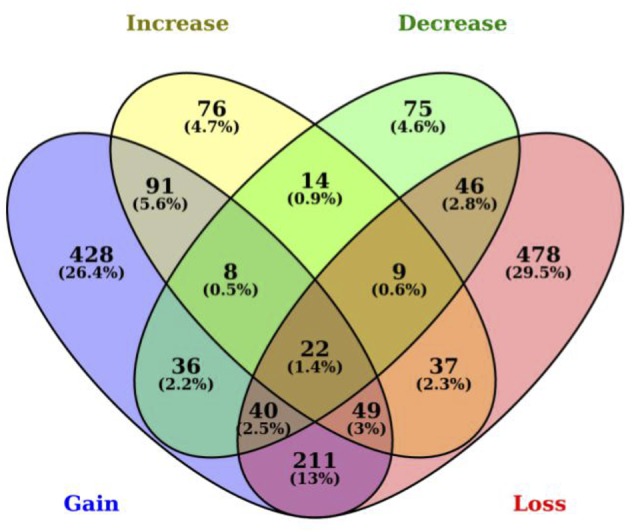
FIGURE 1.

Polymorphisms between Bos taurus and Bos primigenius in 3′ UTRs generate or disrupt miRNA binding sites. Venn diagram representing the number of genes with 3′ UTR polymorphisms between B. taurus and B. primigenius. MiRNA binding sites are represented as gained (blue), lost (yellow), increased (green), or decreased (red). The intersection represents SNPs in 3′ UTRs that generate a binding site for one miRNA while disrupting another miRNA binding site in the same gene (within the same miRNA-binding site region).
