
Figure 3.
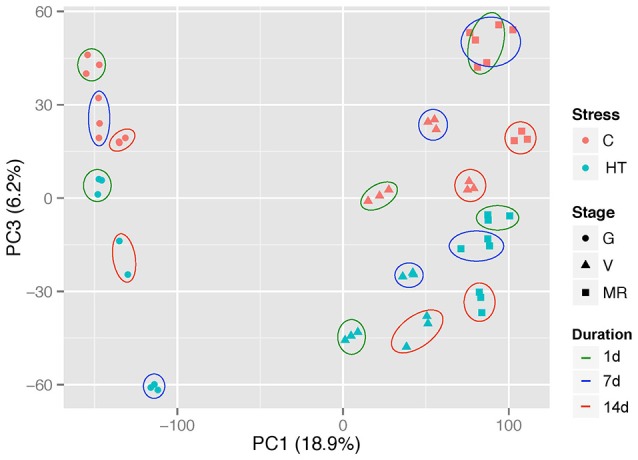
Principal component analysis of the whole normalized gene expression dataset. Red and blue symbols represent control and heated samples, respectively. Solid lines encircle the three replicates of each stage subjected to the same treatment, and the different color lines represent the treatment duration (1, 7, or 14 d). G, green; V, veraison; MR, middle ripening