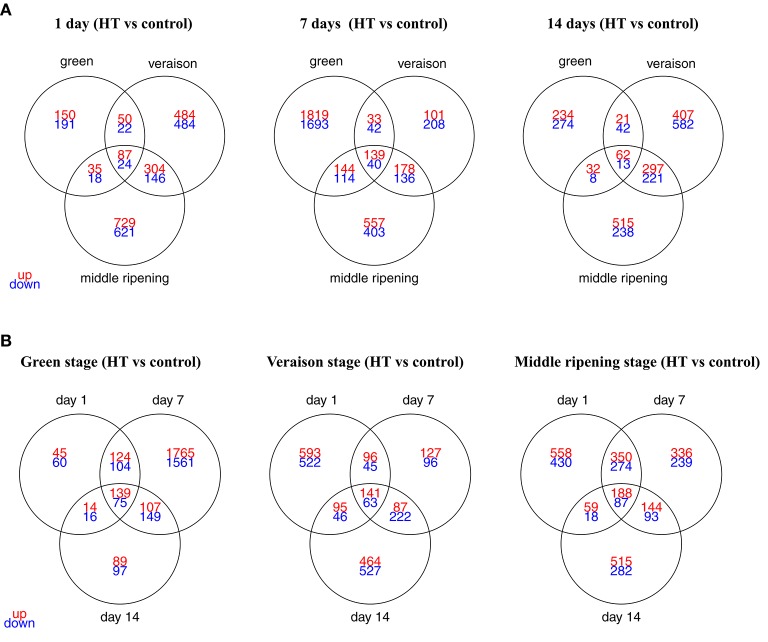
Figure 4.
Venn diagrams displaying the numbers of DEGs in heat-treated berries, according to the developmental stage (A) or the treatment duration (B). DEGs were selected using a 2-fold expression change and an adjusted p < 0.05 (with FDR correction). The detailed information of the common DEGs upon HT for each stage or for each exposure time was listed as in Supplementary Table 1.

