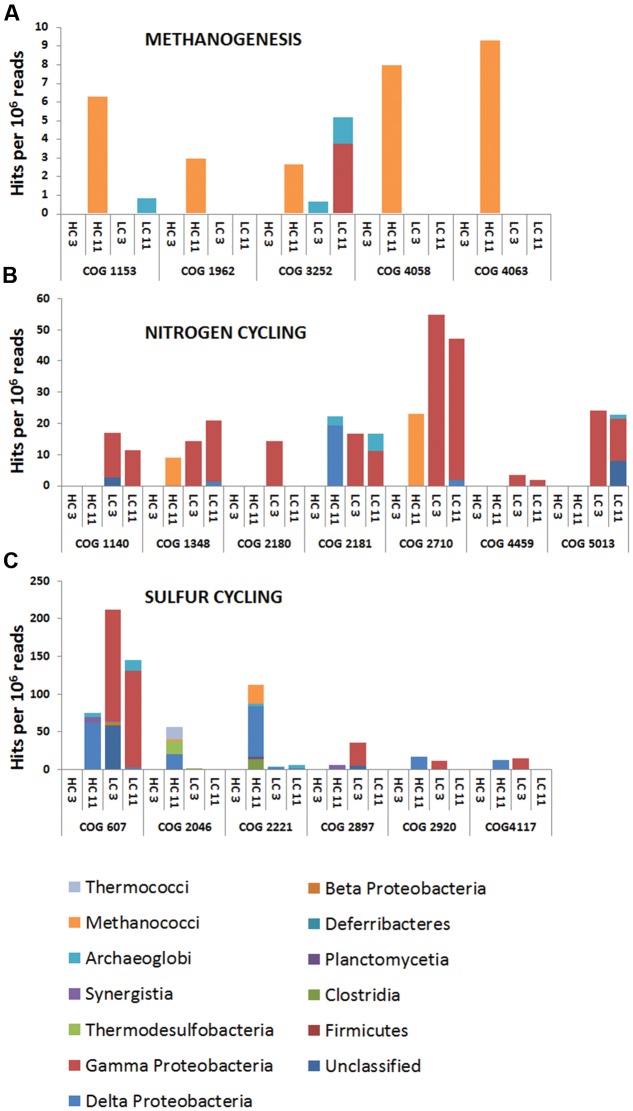
FIGURE 2.
Cluster of Orthologous Groups (COG) analysis of metagenomic data from high corrosion (HC) and low corrosion (LC) pigging samples. Open reading frames (ORF) were predicted from assembled, paired-end read data. Predicted ORFs were compared to the COG database in CAMERA (Sun et al., 2011) and are shown as hit frequencies per million reads (y-axis) where the frequencies were calculated by mapping read data onto predicted ORFs and normalizing to the respective metagenome size. Frequencies for COGs involved in (A) methanogenesis, (B) nitrogen cycling, and (C) sulfur cycling.

