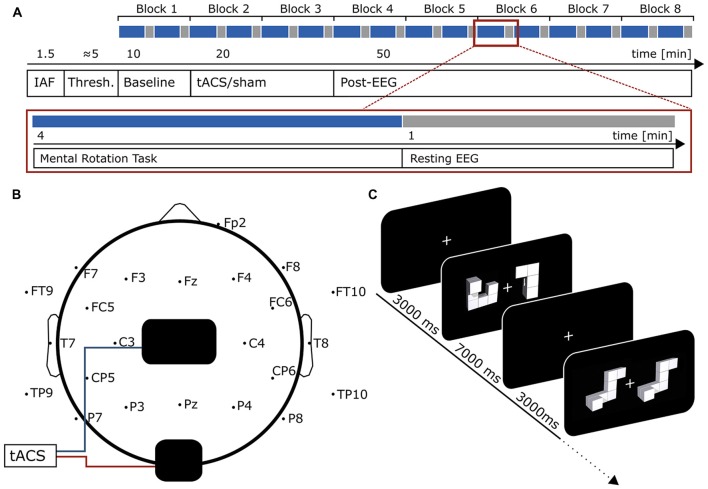
Figure 1.
Experimental Design. (A) Time-course of the experiment. In the beginning, 90 s of eyes-closed EEG was recorded to determine participants individual alpha frequency (IAF). Afterwards, tACS intensity was adjusted to participants’ sensation threshold before the actual experiment started. First, 10 min of baseline measurement were acquired. During the whole experiment participants performed a mental rotation task intermitted by 1 min resting EEG every 24 trials (4 min, red box, blue indicates mental rotation period, gray resting EEG). During resting EEG, participants performed a visual vigilance task. Each block consisted of two mental rotation and two resting periods. The baseline measurement was followed by 20 min of tACS or sham stimulation and 50 min of post-stimulation EEG. (B) Electrode setup. tACS electrodes (black) were positioned centered above Cz and Oz. EEG was measured from 23 positions following the international 10–10 system with electrode sites above or close to tACS electrodes left blank. (C) Mental rotation task. Each trial started with the presentation of a white fixation cross at the center of the screen. After 3000 ms the mental rotation stimulus display (taken from Ganis and Kievit, 2015) appeared and remained on screen for another 7000 ms. During this time, participants were asked to judge whether the two presented figures were identical (but rotated) or different. The first display contains an example for a target differing from the cue, the second for a target similar to the cue.

