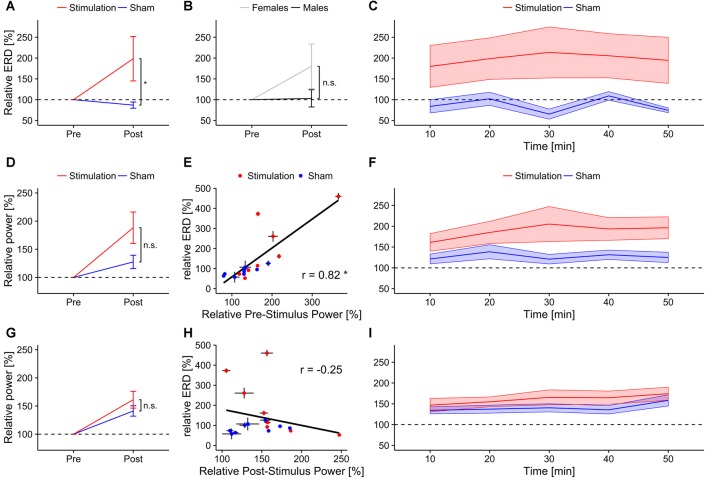
Figure 5.
Event-related-desynchronization (ERD). Error bars and shaded areas depict SEM; asterisks code for significant differences (*<0.05), n.s. = not significant. (A) Overall relative ERD in the individual alpha band for stimulation and sham group. (B) Overall relative ERD in the individual alpha band for female and male subjects. (C) Time-course of relative ERD after stimulation. Bottom rows show relative alpha power 3 s before (reference period; middle row) and after stimulus onset (test period; bottom row). (D) Overall relative pre-stimulus alpha power (reference period) for stimulation and sham group. (E) Scatterplot depicting the correlation between relative pre-stimulus alpha power (test period) and relative ERD. (F) Time-course of relative pre-stimulus alpha power for stimulation and sham group. (G) Overall relative post-stimulus alpha power for stimulation and sham group. (H) Scatterplot depicting the correlation between relative post-stimulus alpha power and relative ERD. (I) Time-course of relative post-stimulus alpha power for stimulation and sham group.

