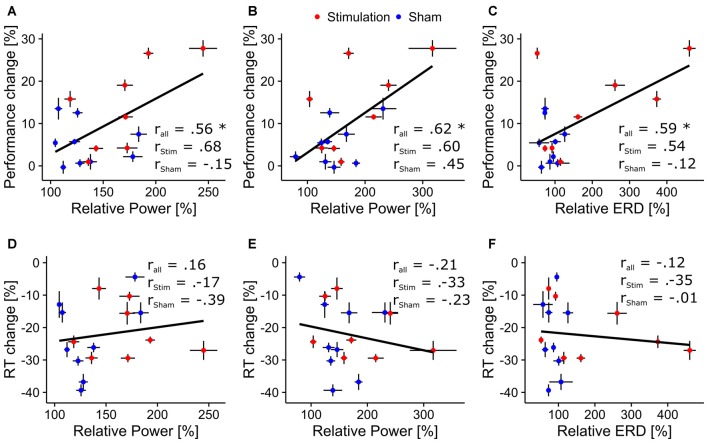
Figure 7.
Correlations between behavioral and physiological measures. Scatterplots depicting correlations between behavioral and physiological aftereffect measures. Asterisks indicate correlations significantly differing from zero. Black bars around the dots indicate their SEM. Top row: correlation between overall performance increase and (A) relative ongoing alpha power during mental rotation, (B) relative ongoing alpha power during rest, (C) relative ERD. Bottom row: correlation between overall change in reaction times and (D) relative alpha power during mental rotation, (E) relative alpha power during rest, (F) relative ERD.

