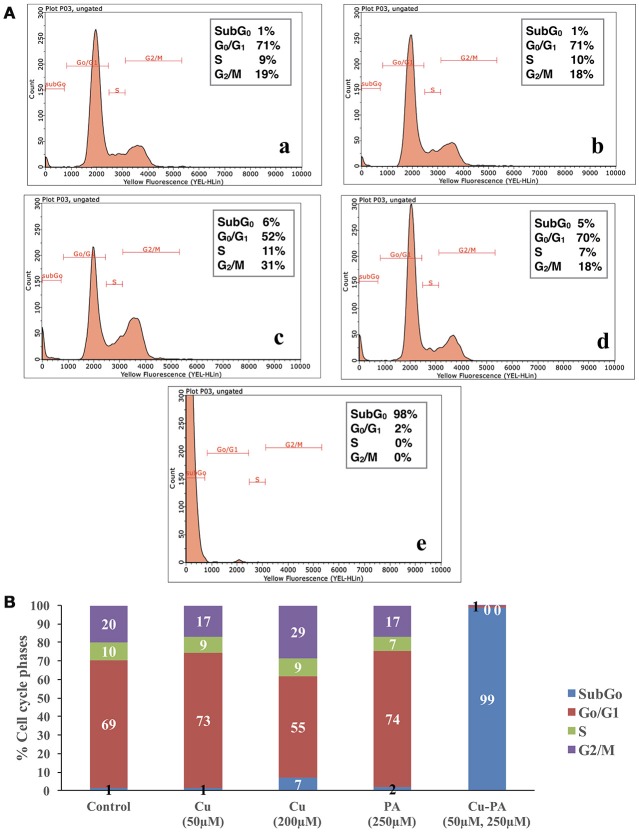
Figure 5.
Cell cycle analysis of U251 cells treated with CuSO4 and/or PA using Guava EasyCyte8 Flow Cytometer. Figure 6A is representative image of one of three experiments: showing the cell cycle phases of U251 cells treated with: (A-a) vehicle water (A-b) 50 μM CuSO4, (A-c) 200 μM CuSO4, (A-d) 250 μM PA, and (A-e) Cu-PA. (B) is the average of 3 different experiments showing the distribution in the cell cycle phases: subG0,G0/G1, S, and G2/M.

