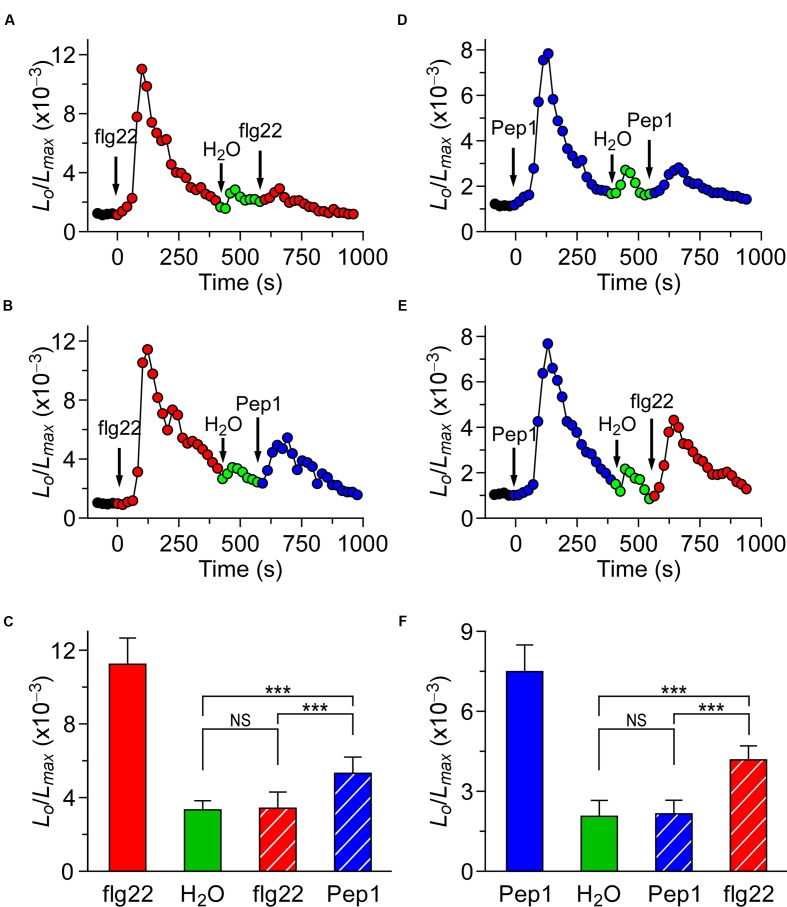
FIGURE 2.
flg22 and Pep1 induced [Ca2+]i increases partly influence each other. (A,B) Arabidopsis seedlings were subjected to a 1 μM flg22 treatment once at 0 s, and the solution was perfused by deionized water at 420 s. Then, a second 1 μM flg22 (A), or 1 μM Pep1 (B) treatment was applied at around 540 s. (D,E) Arabidopsis seedlings were subjected to a 1 μM Pep1 treatment once at 0 s, and the solution was perfused by deionized water at 420 s. Then, a second 1 μM Pep1 (D), or 1 μM flg22 (E) treatment was applied at around 540 s. Aequorin luminescence was recorded continuously through the treatments in the dark. (C,F) Quantification of [Ca2+]i increases for 1 μM flg22 and 1 μM Pep1 treatment from experiments as in (A) to (B), and (D) to (E), respectively. Data for four independent experiments are shown (mean ± SD; n = 16; NS, not significant P > 0.05; ∗∗∗P < 0.001).

