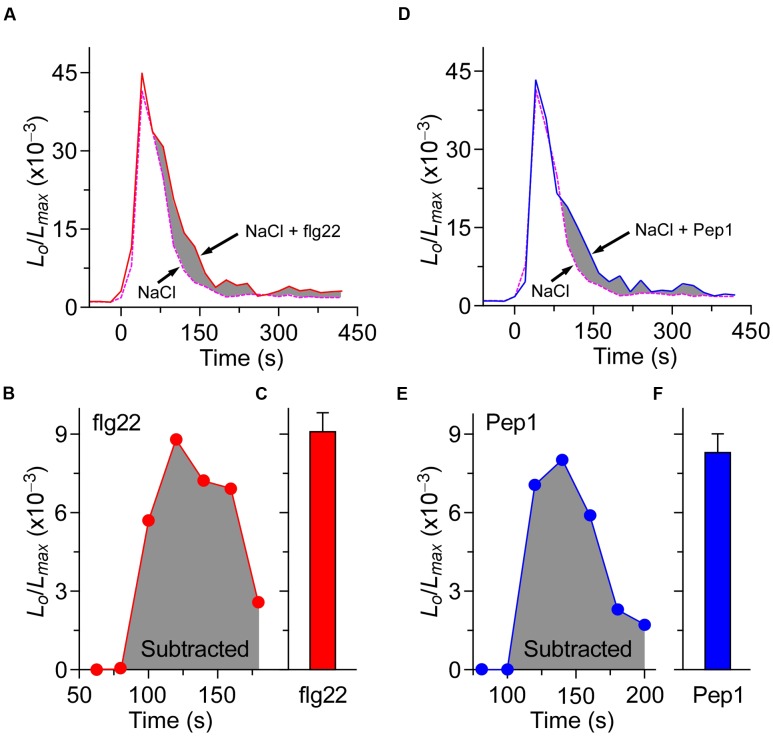
FIGURE 6.
The processes of [Ca2+]i increases induced by biotic and abiotic stresses are independent. (A) Time courses of increase in [Ca2+]i induced by 200 mM NaCl (dashed line) and 200 mM NaCl together with 1 μM flg22 (full line). (D) Time courses of increase in [Ca2+]i induced by 200 mM NaCl (dashed line) and 200 mM NaCl together with 1 μM Pep1 (full line). Seedlings grown for 7 days were treated at time 0, and aequorin images were taken every 20 s. (B,C) Increases in [Ca2+]i induced by 1 μM flg22 that calculated from (A). (E,F) Increases in [Ca2+]i induced by 1 μM Pep1 that calculated from (D). Similar results were seen in four independent experiments using 256 seedlings.

