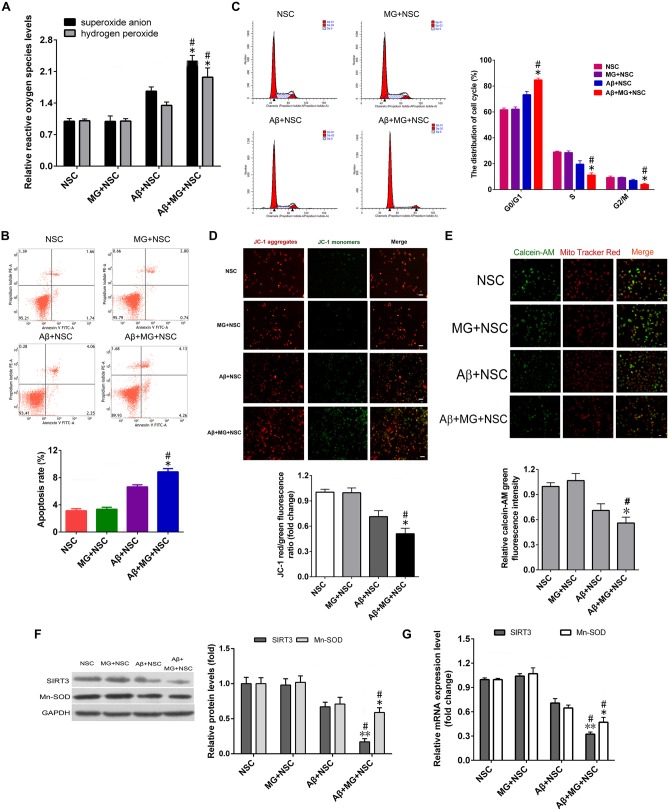
Figure 2.
Microglia activation induces oxidative stress injury and decreased sirtuin 3 (SIRT3), manganese superoxide dismutase (MnSOD) expression in NSCs. (A) The relative changes of superoxide anion and hydrogen peroxide levels in NSCs treated with or without 10 μM Aβ, co-cultured with or without microglia (MG) were evaluated by fluorescent probe dihydroethidium (DHE) and hydrogen peroxide assay kit, respectively. (B) Representative images (up panel) and quantification (down panel) of cell apoptosis in NSCs were determined by Annexin-V/propidium iodide (PI) assay. (C) Representative images (left panel) and quantification (right panel) of cell cycle distribution in NSCs was detected by flow cytometry. (D) Representative images (up panel) and quantification (down panel) of mitochondrial depolarization were assessed as the fluorescence shift of JC-1 from red to green by high-content screening platform analysis, Scale bar = 100 μm. (E) Representative images (up panel) and quantification (down panel) of the NSCs loaded with calcein AM (green) and CoCl2 (cytosolic calcein quencher) to determine the calcein fluorescence in the mitochondria were analyzed by flow cytometry analysis, MitoTracker (red) staining was utilized for localization of mitochondria, Scale bar = 50 μm. The expression of SIRT3, MnSOD in NSC, MG + NSC, Aβ + NSC and Aβ + MG + NSC group was analyzed by Western blot (F) and quantitative reverse transcription-polymerase chain reaction (qRT-PCR; G). Results in (A,D–G) are normalized to that of the NSC group. Data are presented as mean ± S.D. (n = 3). *P < 0.05, **P < 0.01 vs. the MG + NSC group. #P < 0.05 vs. the Aβ + NSC group.

