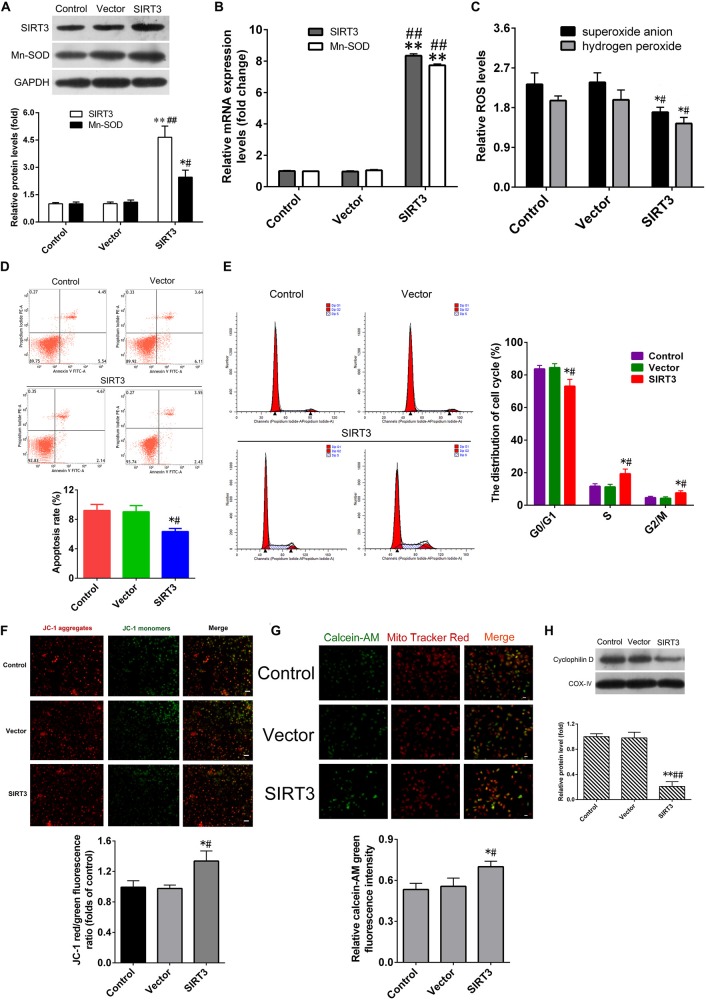
Figure 4.
SIRT3 overexpression alleviates cytotoxicity induced by activated microglia. (A) Representative western blot (up panel) and quantification (down panel) of SIRT3, MnSOD expression in NSCs transfected with the recombinant adenoviral vector overexpressing SIRT3 (SIRT3 group) and empty vector (Vector group) for 48 h. (B) The mRNA expression of SIRT3, MnSOD in NSCs infected with empty vector or SIRT3 plasmid for 36 h. The reactive oxygen species (ROS) production (C), cell apoptosis rate (D) and cell cycle distribution (E) in the Control group, Vector group and SIRT3 group were assessed by methods as showed in Figure 2, respectively. (F) Representative images (up panel) and quantification (down panel) of mitochondrial depolarization in NSCs transfected with SIRT3 plasmid for 48 h were assessed by JC-1 staining, Scale bar = 100 μm. (G) The mPTP opening in NSCs transfected with SIRT3 plasmid for 48 h was determined according to calcein-AM fluorescence intensity by flow cytometry. (H) Representative western blot (up panel) and densitometric quantification (down panel) of cyclophilin D protein expression in NSCs treated with empty vector or SIRT3 plasmid for 48 h. Results in (A–C,F–H) are expressed as fold change over that of Control group. Data are obtained in NSCs co-cultured with microglia challenged with 10 μM Aβ exposure. Data are presented as mean ± S.D. (n = 3). *P < 0.05, **P < 0.01 vs. the Control group. #P < 0.05, ##P < 0.01 vs. the Vector group.

