Figure 4.

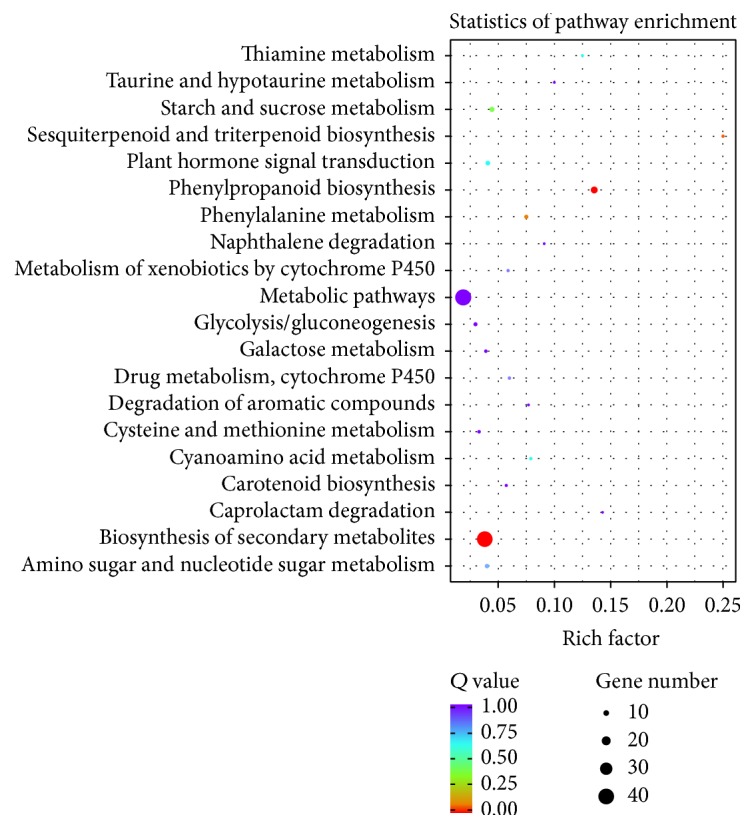
Scatterplot of differentially expressed genes enriched in the top 20 KEGG pathways. Rich factor represents the ratio of the number of DEGs and the number of all unigenes in the pathway; Q value represents corrected P value.

Scatterplot of differentially expressed genes enriched in the top 20 KEGG pathways. Rich factor represents the ratio of the number of DEGs and the number of all unigenes in the pathway; Q value represents corrected P value.