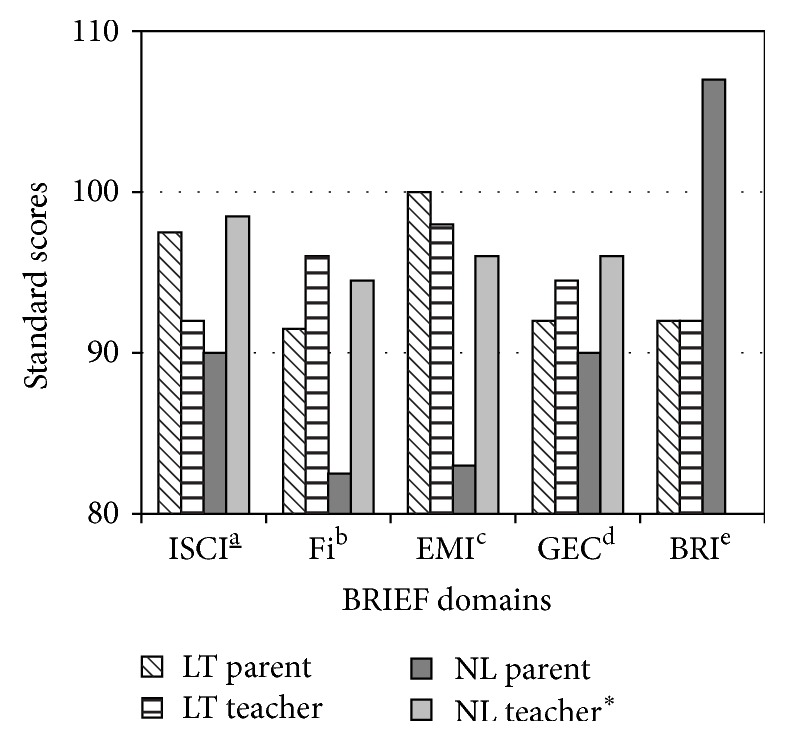
Figure 4.

BRIEF parent and teacher scores between LT and NL group. ∗Higher scores represent poorer perceived functioning. Self-Control Index. bFlexibility Index. cEmergent Metacognition Index. dGlobal executive composite. eBehavioural Regulation Index.
