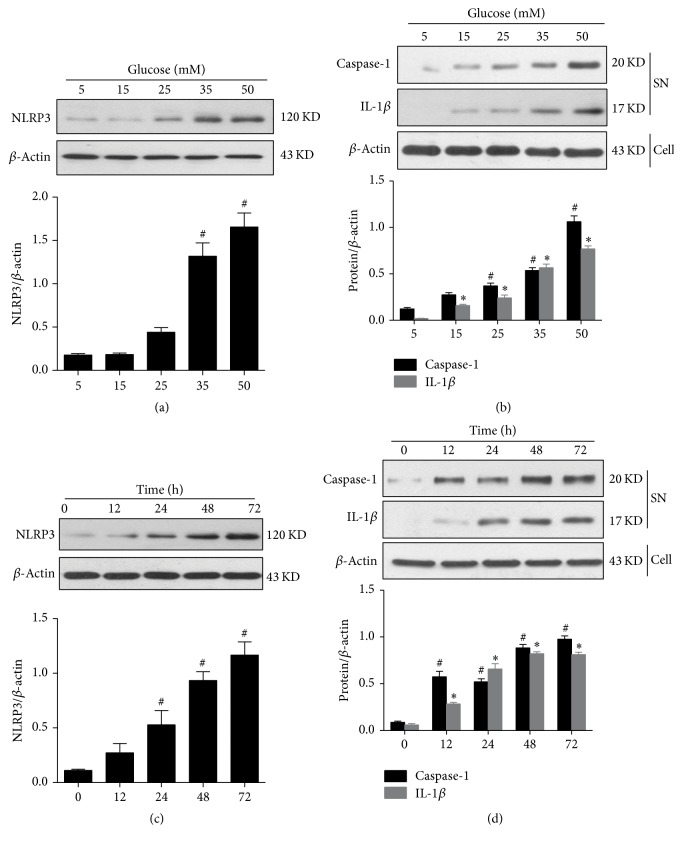
Figure 4.
Time- and dose-dependent effects of glucose on NLRP3 inflammasome activation in HK-2 cells, as assessed using Western blot analysis. (a) NLRP3 protein expression in HK-2 cells exposed to different glucose concentrations for 48 h. (b) Cleaved caspase-1 p20 and 17 kD mature interleukin-1β (IL-1β) in culture supernatants. (c) NLRP3 protein expression in HK-2 cells treated with 35 mM glucose for different time periods. (d) Cleaved caspase-1 p20 and 17 kD mature IL-1β in cell culture supernatants. β-Actin was used as the internal loading control. (a, c) #p < 0.05, compared with cells treated with 5 Mm glucose or cells treated for 0 h. (b, d) #p < 0.05 and ∗p < 0.05, compared with cells treated with 5 mM glucose or cells treated for 0 h. The average values from three independent experiments are shown.

