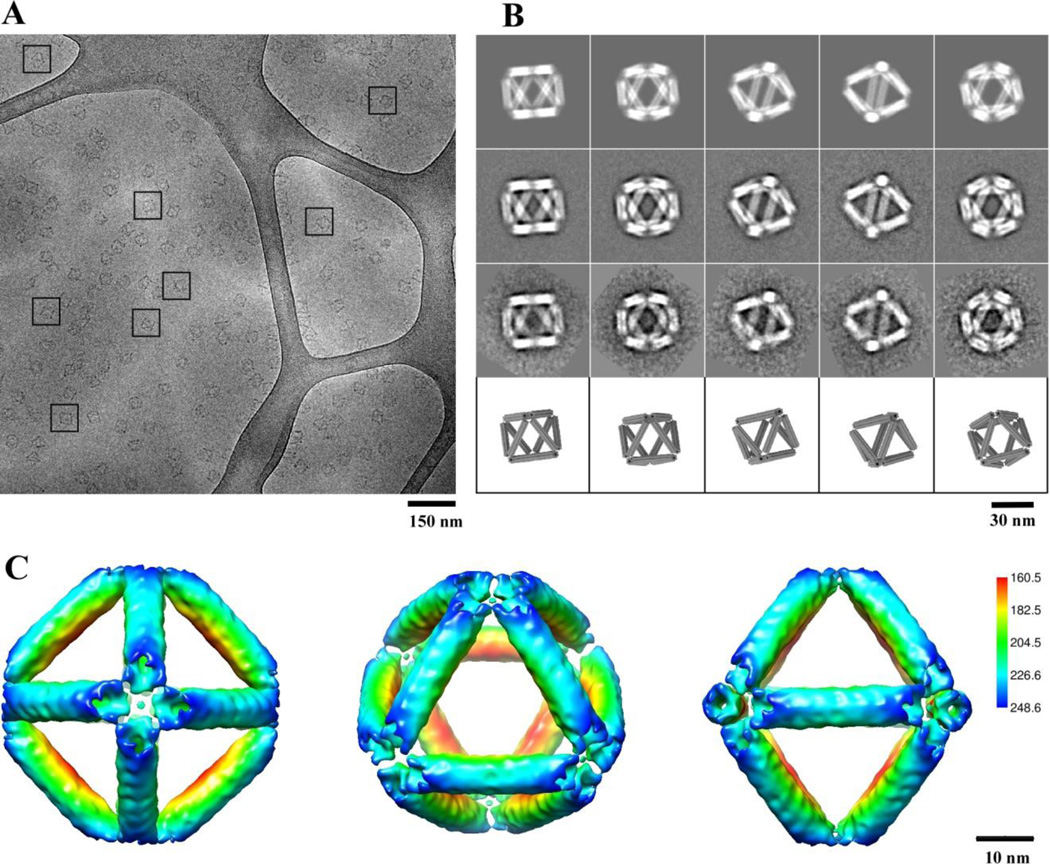
Figure 2. Cryo-EM and 3D reconstruction of the self-assembled DNA origami octahedron.
(A) A cryo-EM micrograph with representative views of DNA octahedron boxed by a black square. Only cluster structures that were embedded in the vitreous ice and suspended over the irregular holes in the carbon film substrate were selected for further analysis. (B) Comparison of 2D reprojections of the reconstructed 3D density map (top row), with reference-based class averages (second row), reference-free class averages (third row), and with the corresponding views of the 3D design model (bottom row). (C) Surface-rendered 3D density map of the DNA octahedron, as viewed from the 4-fold (left), 3-fold (middle), and 2-fold (right) symmetry axis. The density surface is colored radially from interior red to outer blue. The color key is shown on the right. The values in the color key indicate the distance in angstrom from the octahedral center.

