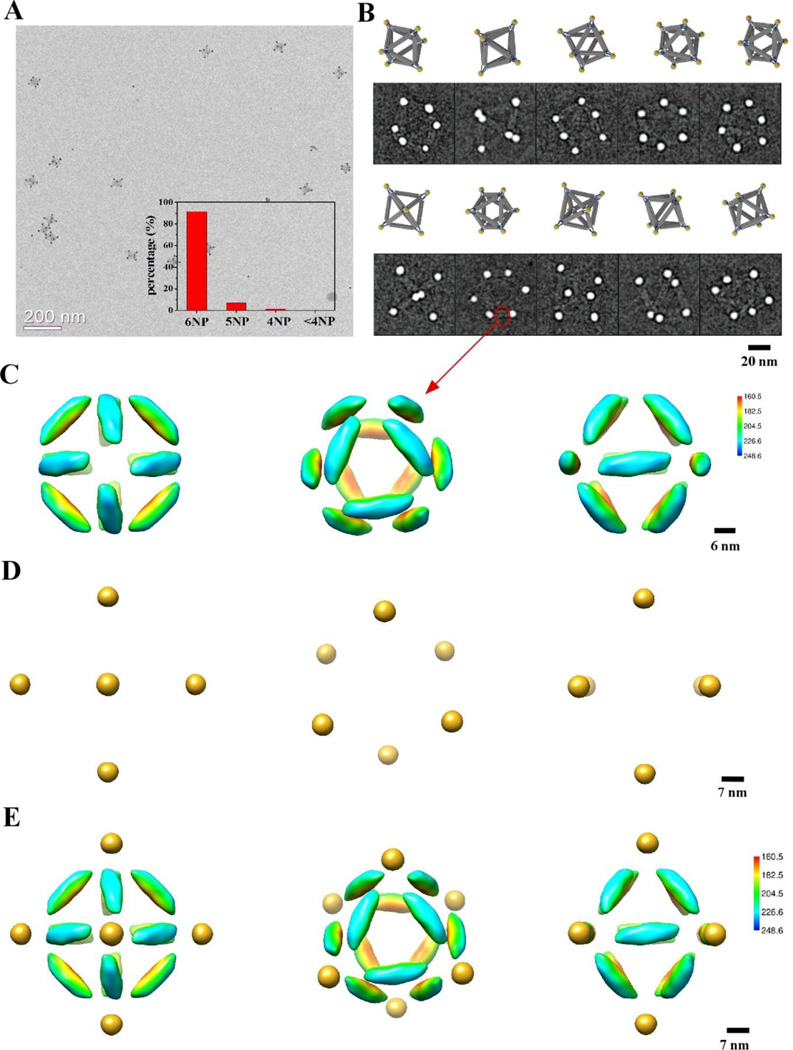
Figure 3. The P6 cluster structure as revealed by cryo-EM and 3D reconstruction.
(A) A representative EM image of the P6 cluster structure. Inset shows the histogram of assembled clusters with observed NP numbers. (B) Ten selected cryo-EM images of the fully assembled P6 octahedron-NP clusters (second and forth rows), in comparison with the 3D design model in corresponding views (first and third rows). (C) 3D reconstruction of the DNA portion of the P6 cluster by excluding the high intensity NPs in cryo-EM images. The density surface is colored in the same way as Figure 2C. (D) 3D reconstruction of the six NPs of the P6 cluster by using only the high intensity NP scattering signals in the cryo-EM dataset. (E) The composite 3D EM structure of the P6 cluster derived by computationally combining the structures shown in (C) and (D). The left, middle, and right panel in (C–E) shows 4-fold, 3-fold, and 2-fold views of the respective structure.

