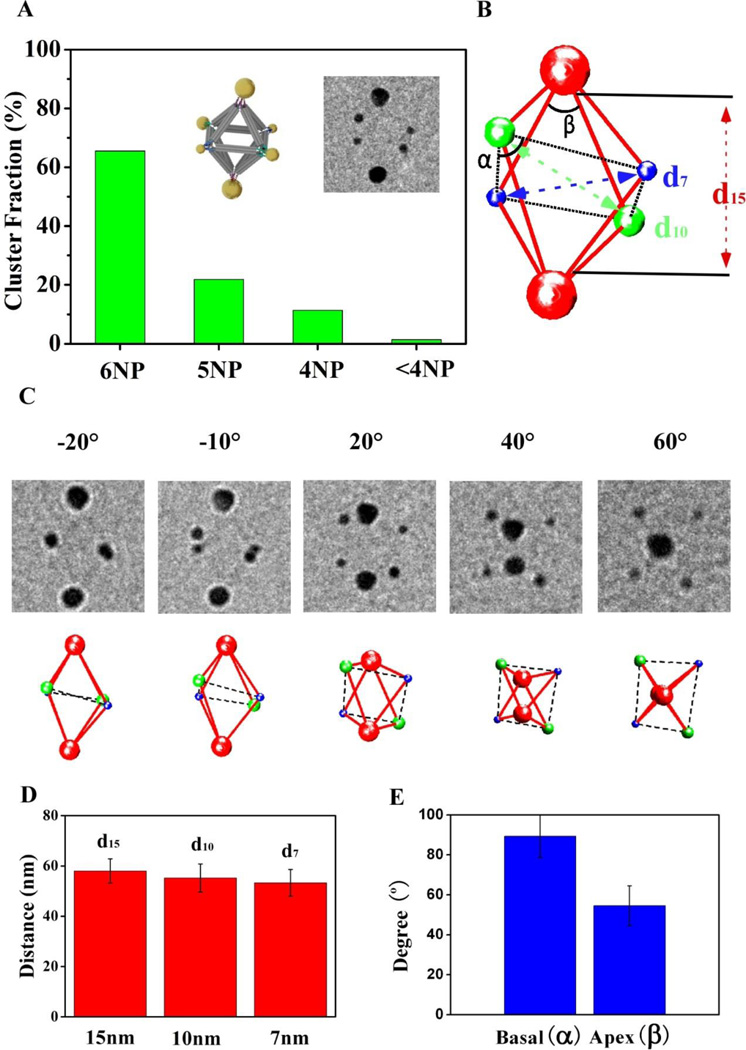
Figure 5. Electron tomography of individual hetero-cluster, P12(12)P22(34)P32(56), assembled with three types of NPs.
(A) Statistical analysis of the NP cluster population. The design model and a representative cryo-EM image of the assembled cluster (untilted view) are shown as insets. (B) Reconstructed 3D structure of the NP cluster shown on the inset of (A). The surface-to-surface distance between the diagonally paired 7-nm, 10-nm, and 15-nm NPs are denoted by d7, d10, and d15, respectively. α is the angle centered around the 10-nm NPs, and β around the 15-nm NPs, respectively. (C) Images obtained by tilting the cluster shown in (A) at different angles (from left to right: −20°, −10°, 20°, 40°, 60°) (top row), in comparison with corresponding views of the reconstructed 3D structure. (D) Averaged distances between the diagonally paired 7-, 10-, and 15-nm NPs measured from 12 independently reconstructed P12P22P32 clusters: d15 = 58.0 ± 4.8 nm, d10 = 55.1 ± 5.6 nm, and d7 = 53.3 ± 5.3 nm. (E) Averaged values of the basal (α=89.4° ± 10.9°) and vertex (β = 54.5° ± 10.0°) angles.

