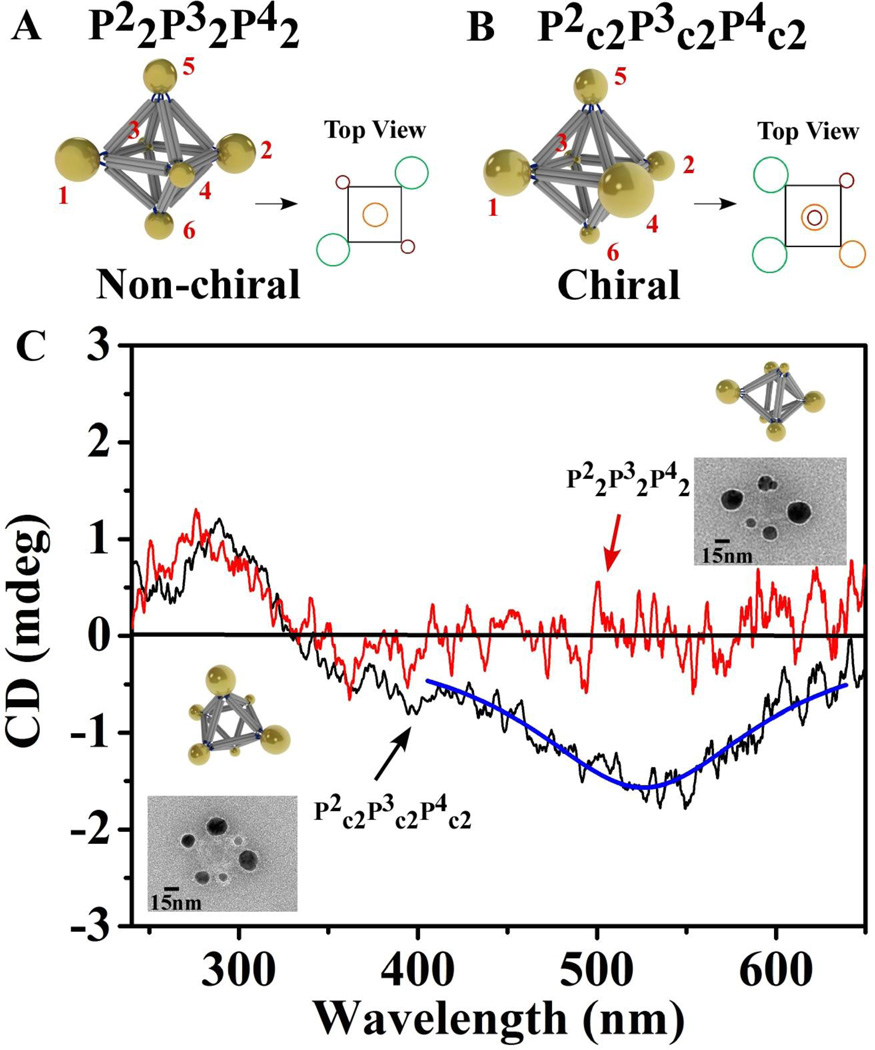
Figure 6. CD spectra of octahedron based non-chiral cluster P22(34)P32(56)P42(12) (denoted as P22P32P42) and chiral cluster P22(26)P32(35)P42(14) (denoted as P2c2P3c2P4c2).
(A). Model of non-chiral cluster P22P32P42 with its top view. (B). Model of chiral cluster P2c2P3c2P4c2 with its top view. (C). Red line is the CD spectrum for cluster P22P32P42. The representative TEM image and the model with same orientation are shown at the right top corner. Black line is the CD spectrum for cluster P2c2P3c2P4c2 and the blue line is the Lorentzian fit. The representative TEM image and model with same orientation are shown at the low left corner. The CD peaks at about 270 nm for both types of clusters are DNA signatures.

