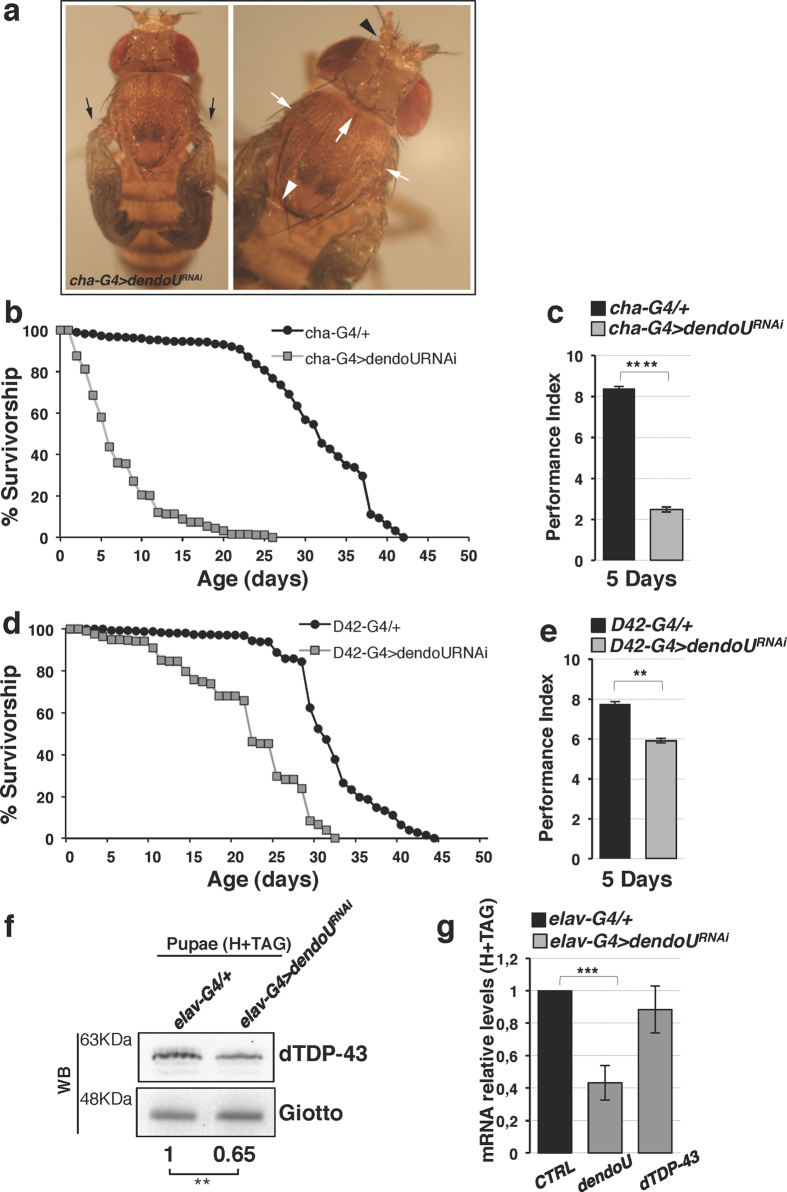
Figure 5. Functional effects of dendoU inactivation in neuron subtypes.
(a) Juvenile phenotype in cha-G4 > dendoURNAi flies. Morphological defects are indicated as in Fig. 4c. (b) Diagram showing viability in cha-G4 > dendoURNAi flies. Median lifespan in experimental flies (grey squares) was 7.57 ± 0.18d, whereas it was 31.06 ± 0.37d in controls (black circles). The log rank test showed that the two curves were significantly different (P < 0,001). (c) Flies with indicated genotypes and age were tested using a standard climbing assay. The performance index (expressed as the percentage of flies that climbed to the top vial relative to the total number of tested flies) was significantly lower in cha-G4 > dendoURNAi flies (grey bar) compared to controls (black bar). All average data are presented as mean ± SEM (n ≥ 100 flies per genotype) and compared with 2-tailed unpaired t-tests. Tests were performed using Prism (GraphPad Software, Inc.). P value, ****p < 0.0001. (d) Diagram showing viability in D42-G4 > dendoURNAi flies. Median lifespan in experimental flies (grey squares) was 21.53 ± 0.50d and it was 31.38 ± 0.26d in control flies (black circles). The log rank test showed that the two curves were significantly different (P < 0.001). (e) Locomotor deficit in 5-day-old flies interfered for dendoU in motor neurons. The climbing performance in D42-G4 > dendoURNAi flies (grey bar) was significantly lower compared to control flies (black bar). Statistics as in panel c. P values, **p = 0.0015. (f) Western blot of dTDP-43 in head and thoracic-abdominal ganglia (H + TAG) dissected from pan-neuronal dendoU interfered pupae. Giotto was used as internal control. Result was expressed as means for at least three independent biological replicates. (g) qRT-PCR analysis of dendoU and dTDP-43 mRNAs (grey bars) in the same samples as in (f). Expression levels in control samples are set as 1 (black bar). Data are presented as mean ± SD in triplicates (***P < 0.001, Paired T-test). The full-length versions of the cropped blots are shown in Supplementary Figure 7b.

