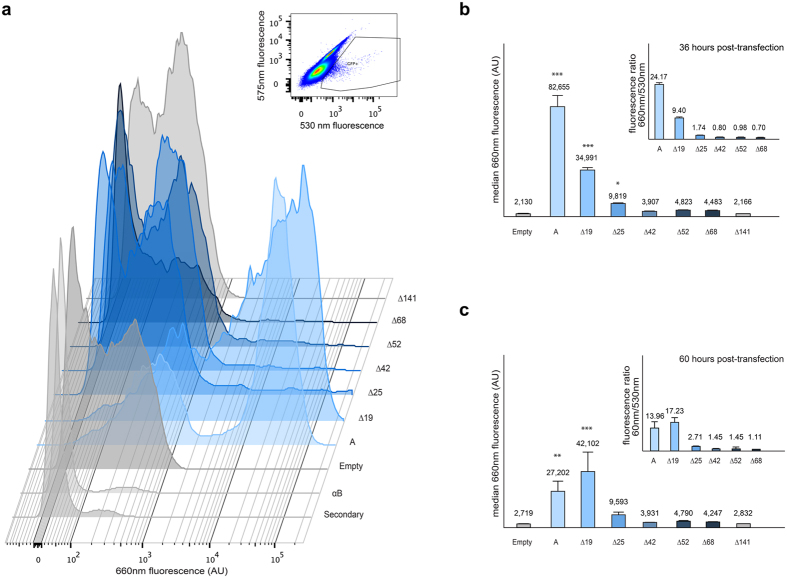
Figure 2. Cytometry analysis of A antigen synthesis capacity.
(a) HeLa FUT2 cells transfected with A transferase constructs were selected by increased 530 nm fluorescence from the global population as seen in the upper inset. The composite histogram shows the 660 nm fluorescence of those cells corresponding to the presence of A antigen by detection of a secondary antibody conjugated to Alexa647 binding in turn to an anti-A antigen antibody. The “Secondary” histogram corresponds to A transferase transfected cells treated without primary antibody, the “αB” to the same cells treated with anti-B antibody instead of anti-A antibody. The rest of cells were stained both with anti-A and the secondary antibody. The “Empty” graph shows the staining of cells transfected with an empty vector, “A” with the A transferase construct, and further on. The X-axis shows fluorescence at 660 nm on an exponential scale. The height of the graph corresponds to the number of cells for each fluorescence value. (b) The median of 660 nm fluorescence is shown of each construct from five independent experiments after 36 h post-transfection. ***P < 0.001, *P > 0.05 assigned by the Duncan test. The inset graph shows the mean of the 660 nm/530 nm fluorescence for each data point. (c) The median of 660 nm fluorescence after 60 h post transfection. ***P < 0.001, **P > 0.01.

