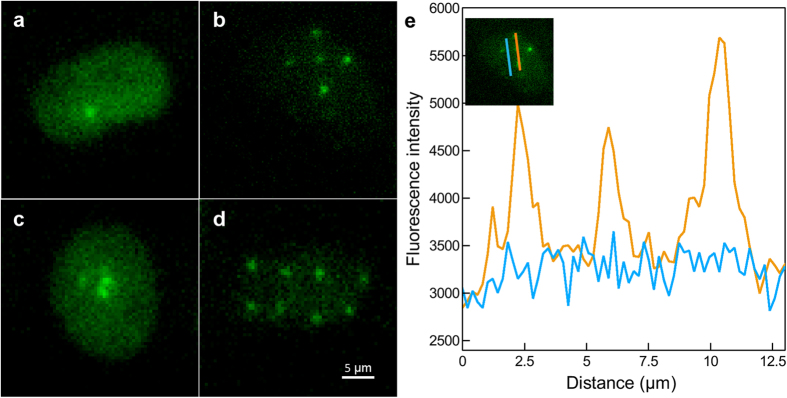
Figure 4. Heterogeneity of GFP-RNF8 response in cell nuclei irradiated with different patterns.
Cells are irradiated with (a) one α-particle, (b) 5 α-particles distributed on a cross pattern. The targeted positions are separated by 4 μm. (c) 10 α-particles focalized on one position, and (d) regular pattern scanned over the whole microscope field of view. 8 α-particles induced-foci are distributed in the nucleus. (e) Fluorescence intensities measured along the two lines drawn in the inset plotted against their length. The blue line shows the constant nuclear fluorescence background; the orange line shows three peaks corresponding to the IRIF. Three different fluorescence intensities are observed suggesting an inhomogeneous chromatin density.

