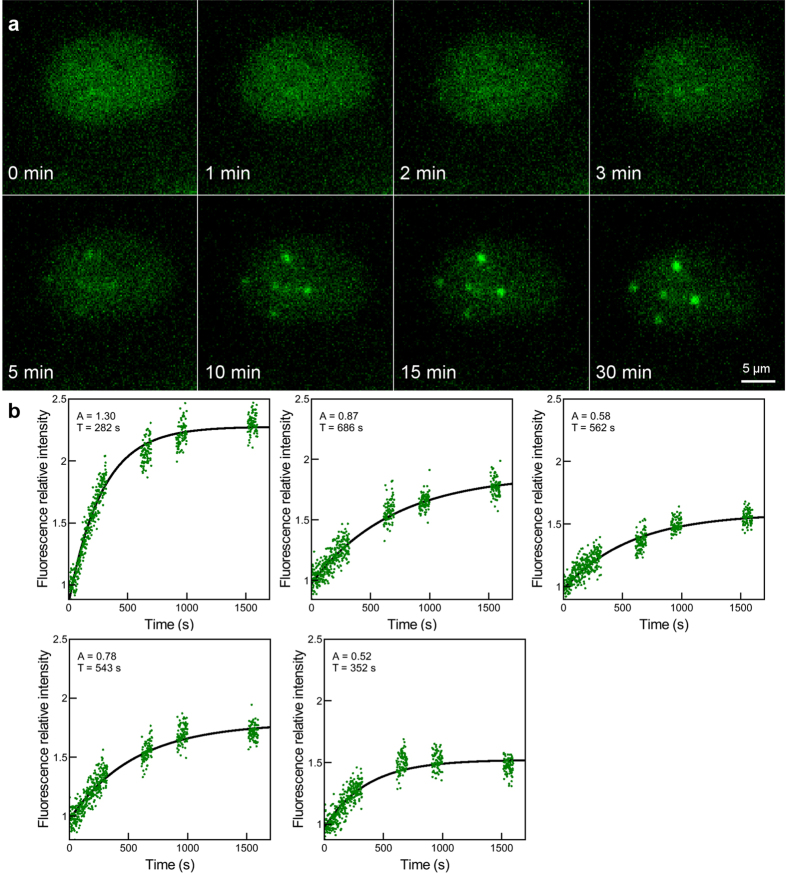
Figure 5. Time-lapse imaging of GFP-RNF8 in a cell nucleus irradiated with single α-particles.
(a) The cell nucleus is targeted and irradiated at time 0 with a single α-particle per point on a cross pattern, each point separated by 4 μm. The re-localization of GFP-RNF8 is observed over 30 min following irradiation and selected time points are shown. (b) Kinetics curves of GFP-RNF8 corresponding to each IRIF obtained from experimetal data. Experimental curves (green points) are normalized and fit (black line) with a model for the first-order response. The intensity fluorescence of GFP-RNF8 protein in the damaged areas is higly variable, as described in each inset by the A parameter. The recruitment time (T) varies independently from the intensity fluorescence reached.

