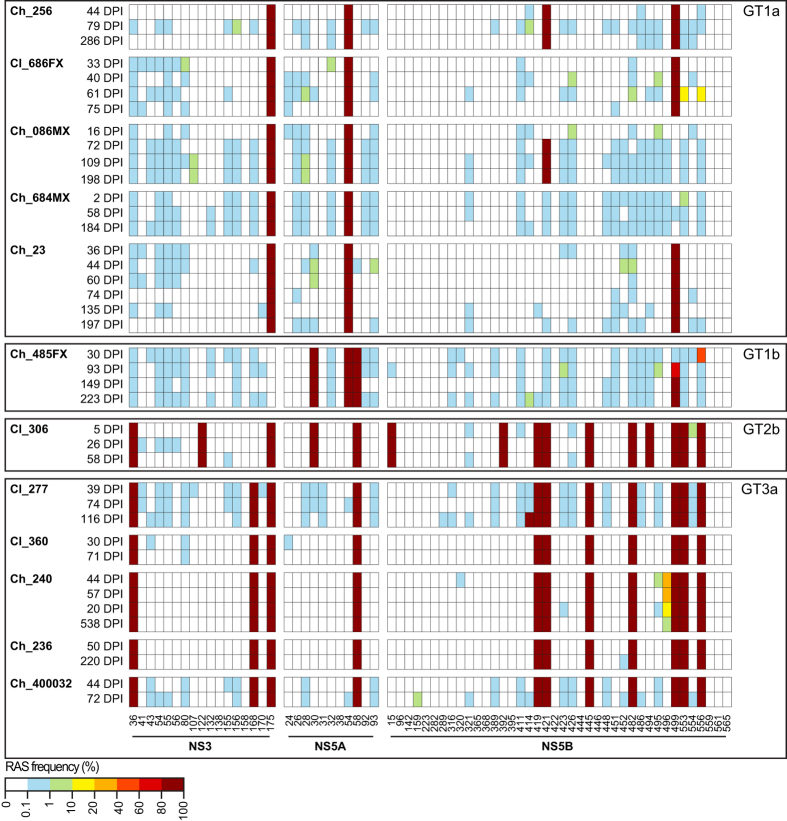
Figure 1. Longitudinal analysis of HCV resistance-associated substitutions (RAS) in early HCV infections.
RASs are shown in longitudinally sampled infections across HCV NS3, NS5A and NS5B. Rows represent individual samples and columns indicate amino acid positions, grouped by different coding regions and numbered at the bottom. Sample identification numbers are shown together with the estimated days post infection (DPI) to the left of each row. Samples are grouped by HCV genotype (GT). The frequency of RASs is indicated by the color according to the scale bar. RASs that are fixed within an HCV genotype34 (i.e. consensus RASs) are presented with 100% frequency across time-points.

