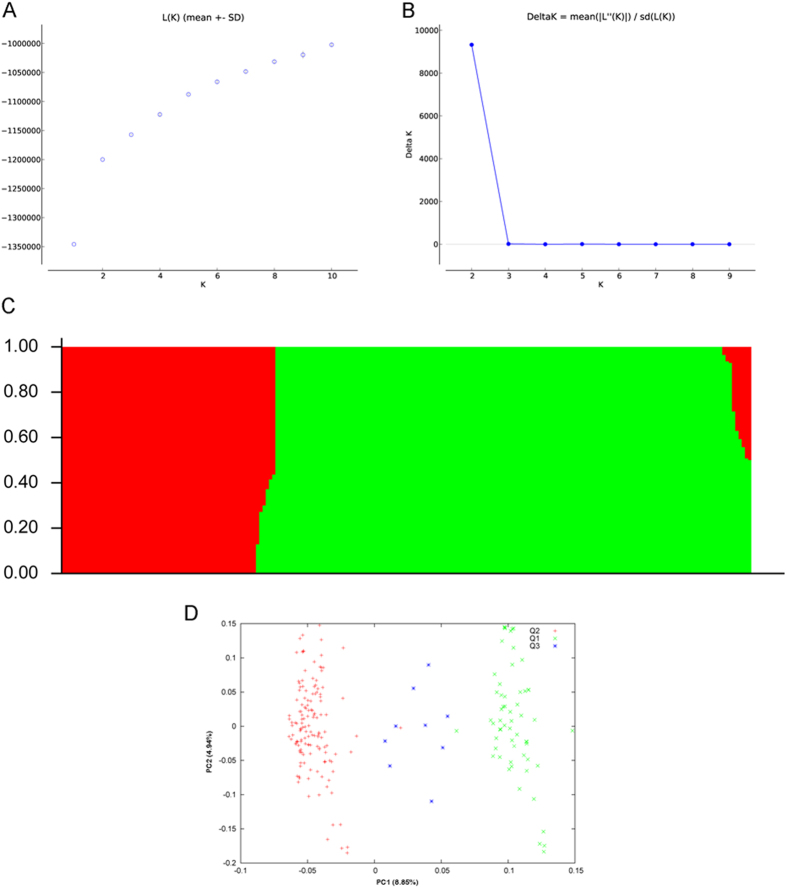
Figure 2. Analysis of the population structure of 210 rapeseed accessions using STRUCTURE.
(A) Estimated L(K) of possible clusters (k) from 1 to 10. (B) Delta K based on the rate of change of L(K) between successive K values. (C) Population structure based on k = 2. Red represents subgroup Q1; green represents subgroup Q2. (D) Principal component (PC) analysis.

