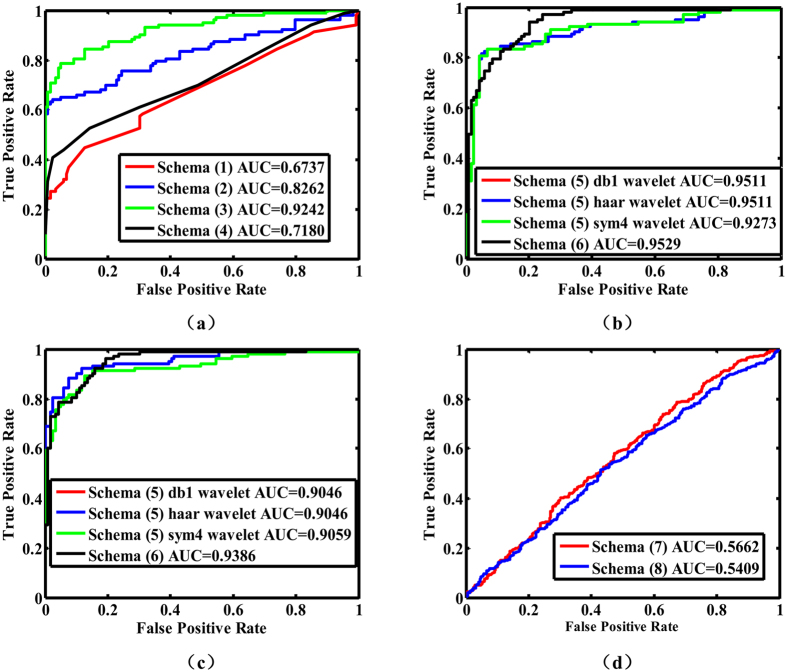
Figure 2. ROC curves for eight schemas.
This figure shows the ROC curves of eight schemas (a) is the ROC curves of schema (1), (2), (3) and (4), where the k of schema (4) is 10; (b) shows the ROC curves of schema (5) and (6). Schema (5) contains the discrete wavelet transformation with three different wavelets which is used as a method to extract image feature. So there are three different curves about schema (5), where two curves are coincident. The kernel function in SVMs (support vector machines) of these two schemas is linear kernel function; (c) shows the ROC curves of schema (5) and (6). Schema (5) contains the discrete wavelet transformation with three different wavelets which is used as a method to extract image feature. So there are three different curves about schema (5), where two curves are coincident. The kernel function in SVMs of these two schemas is polynomial kernel function; (d) displays the ROC curves of schema (7) and (8). The over-complete dictionary of schema (7) is formed with 1 negative sample and 80 positive samples, whereas that of schema (8) is formed with 5 negative samples and 70 positive samples (the sample size in schema (6) is 5 × 10). All sub-images are from the first-fold out of four-fold cross-validation. (ROC: receiver operating characteristics curve; AUC: area under the curve).

