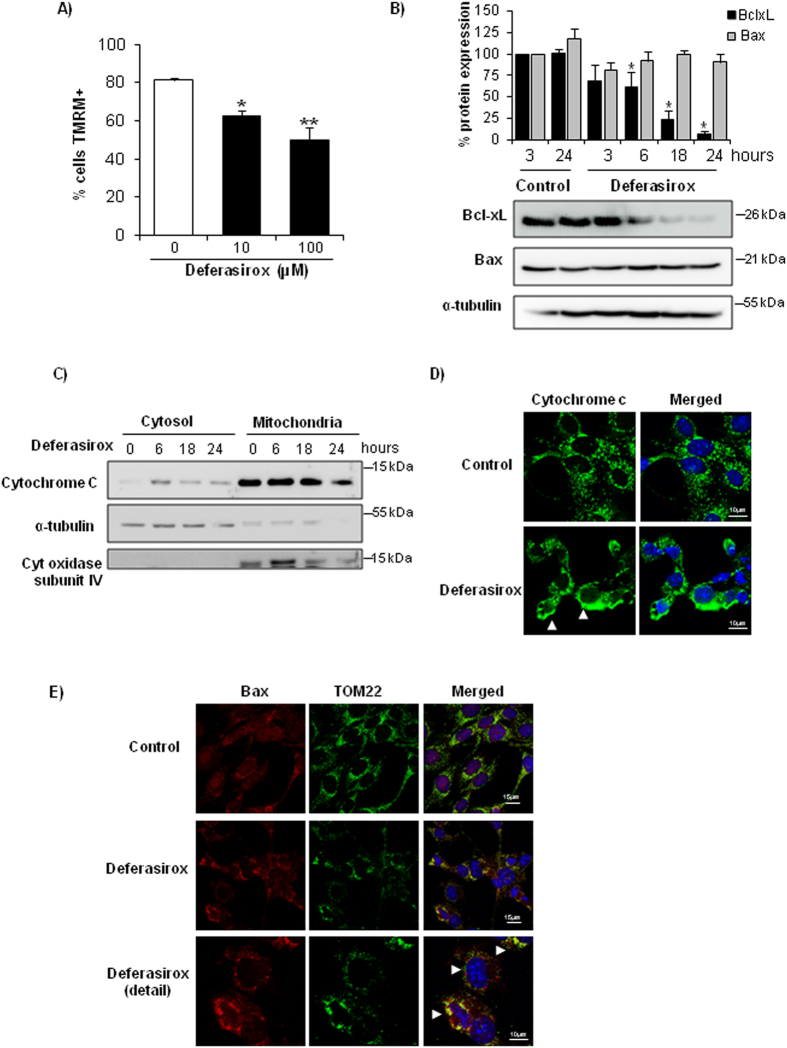
Figure 3. Deferasirox induces mitochondrial stress in tubular cells.
(A) Tubular cells were exposed to deferasirox for 24 h and loss mitochondrial membrane potential (MMP) was assessed by TMRM staining and flow cytometry. Mean ± SEM of three independent experiments. *p < 0.03 vs control, **p < 0.003 vs control. (B) Western blot of BclxL and Bax in tubular cells exposed to 10 μM deferasirox for different times. Data expressed as % change versus control, which was considered to be 100%. Note that BclxL is severely decreased in presence of deferasirox, while Bax does not change, leading to a decreased BclxL/Bax ratio. Mean ± SEM of three independent experiments. *p < 0.003 vs control. Full-length blots is presented in Supplementary Figure 2. (C) Cytochrome c is released from mitochondria in tubular cells exposed to deferasirox in a time-dependent fashion. Cytochrome oxidase subunit IV and α-tubulin are controls for fraction separation and loading. Western blot representative of three experiments. Full-length blots is presented in Supplementary Figure 2. (D) Localization of cytochrome c in tubular cells exposed to 10 μM deferasirox for 6 hours. Note the punctate mitochondrial pattern in control cells and diffuse labeling in deferasirox-exposed cells (arrowheads). Confocal microscopy. Cytochrome c in green and DAPI in blue, original magnification x63. Images representative of three experiments. (E) Deferasirox for 24 hours induces Bax translocation to mitochondria, where it forms aggregates, and colocalizes with mitochondrial receptor TOM22 that appears aggregated (arrowhead). Confocal microscopy: Bax in red, TOM22 in green and DAPI in blue. Original magnification x63, detail x100. Images representative of three experiments.

