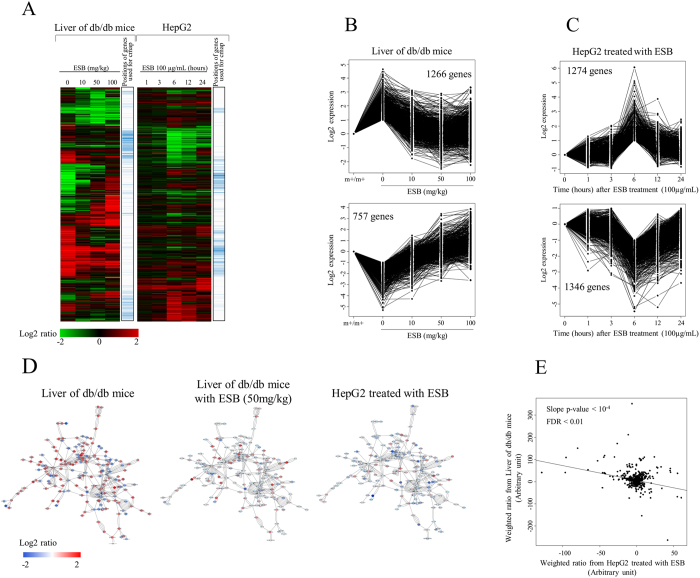
Figure 3. Effects of ESB on db/db mouse liver and HepG2 cells.
(A) Expression patterns of genes were compared between db/db mouse liver given different doses of ESB and in HepG2 hepatocellular carcinoma cells exposed to ESB for different times. To identify the genes using the quantitative analysis of their expression, STEM was applied and the resultant ESB-responsive genes (FDR < 0.001) are plotted for (B) db/db mouse liver and (C) HepG2 cells. m+/m+ represents normal control mice of C57BLKS/J-m+/m+. (D) Differentially expressed genes in db/db mouse liver were mapped into the protein-interaction network database and the directly connected largest cluster was isolated. The levels of gene expression are depicted in colors as shown in the scale bar. (E) Log values for each differentially expressed gene in db/db mouse liver were multiplied by the degree value for each gene to give a weight according to the positional importance of the gene in the protein-interaction network. The weighted expression values were then plotted for db/db mouse liver and ESB-treated HepG2 cells.

