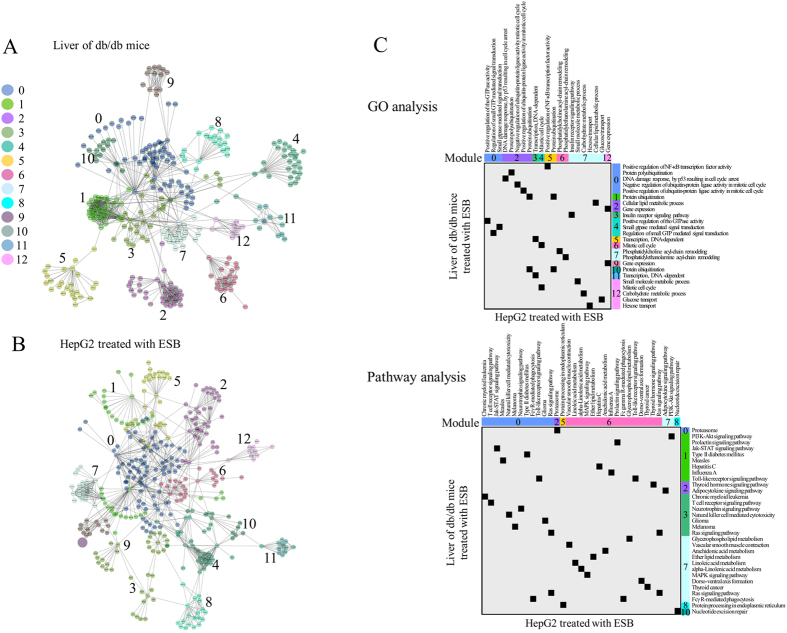
Figure 6. Functional network analysis.
The functional interaction network was constructed from the gene expression patterns of (A) db/db mouse liver and (B) HepG2 cells treated with ESB by implementing the Reactome FI application. In total, 13 modules are shown in different colors as indicated from 0 to 12. (C) GO terms and pathways associated with each module (p < 0.01) were plotted for db/db mouse liver and HepG2 cells treated with ESB.

