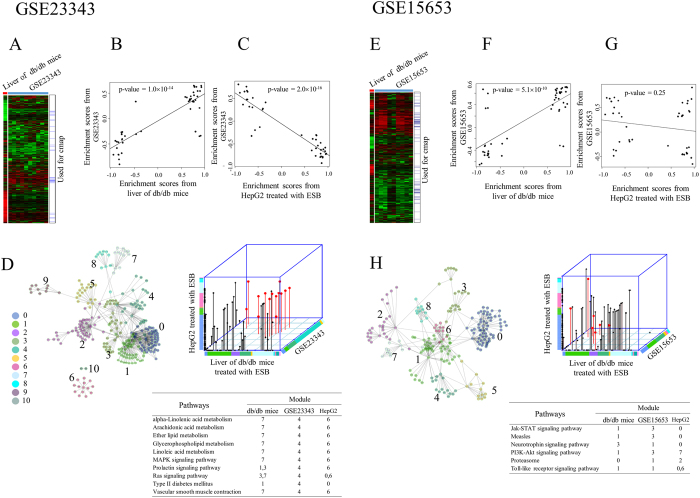
Figure 7. Analysis of human diabetic liver.
Cmap and functional network analysis were performed using two public microarray data sets. Overall gene expression patterns are shown for (A) GSE23323 and (E) GSE15653 in which genes were hierarchically clustered according to ratio compared to the normal control. The positions of genes used for cmap analysis, which were selected from the SAM algorithm, are also indicated. Enrichment scores (permutated p-value < 0.05) resulting from the cmap analysis of GSE23323 were compared with those from (B) db/db mouse liver and (C) HepG2 cells treated with ESB. In same way, enrichment scores (permutated p-value < 0.05) resulting from cmap analysis of GSE15653 were compared with those from (F) db/db mouse liver and (G) HepG2 cells treated with ESB. Functional modules from the interaction network are presented in (D) for GSE23323 and (H) for GSE15653. Common pathways associated with each module (p < 0.01) from db/db mouse liver, HepG2 cells treated with ESB, and GSE23323 (or GSE15653) are shown in red and listed.

