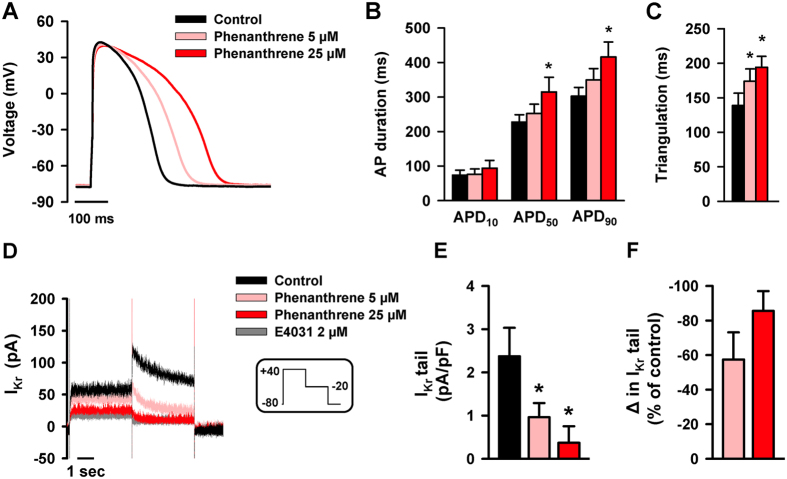
Figure 5. Phenanthrene disrupts electrical activity of the bluefin tuna ventricular myocytes.
(A) Representative action potentials (APs) recorded with current-clamp in a ventricular myocyte under control conditions (black) and with an increasing concentration of phenanthrene (pink/red traces). (B) Means ± SEM (n = 9, N = 5) of action potential duration (APD) at 10, 50 and 90% repolarization and (C) AP triangulation (calculated as APD90 − APD30) before and after phenanthrene exposure. (D) Reduction in the delayed rectifier K+ channel current (IKr) density recorded with voltage-clamp under control conditions (black) and with an increasing concentration of phenanthrene (pink/red traces) or with the IKr specific blocker E4031 (gray trace). (E) Means ± SEM of peak IKr tail in control (black bar) and with an increasing concentration of phenanthrene (pink/red bars, n = 7, N = 3). (F) Change in IKr tail (expressed as a percentage of control) in response to phenanthrene. *Indicates significant difference (P < 0.05, one-way ANOVA).

