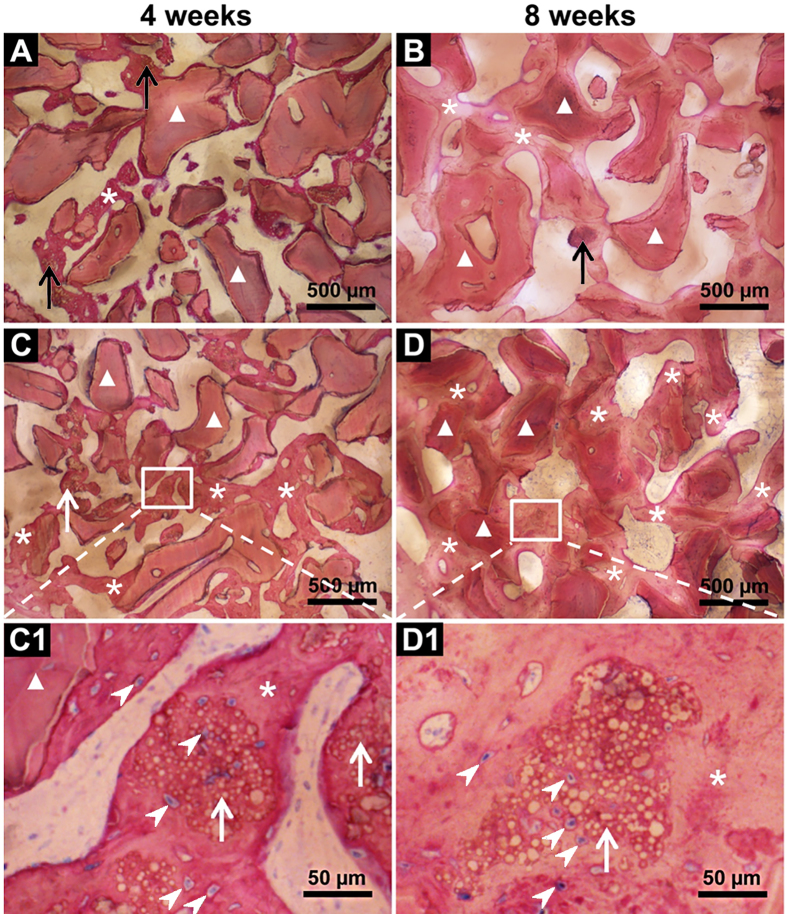
Figure 4. Representative histological images of the bone defect slices.
(A) DBB + BioCaP-group at week 4. (B) DBB + BioCaP-group at week 8. (C) DBB + BMP2-cop.BioCaP-group at week 4. (D) DBB + BMP2-cop.BioCaP-group at week 8. (C1) high-resolution image of C. (D1) high-resolution image of D. BioCap (black arrow), BMP2-cop.BioCaP (white arrow), BioCaP or BMP2-cop.BioCaP in close contact with newly formed bone (*), osteocyte-like cells (white arrow heads), and DBB in close contact with newly formed bone (white triangle).

