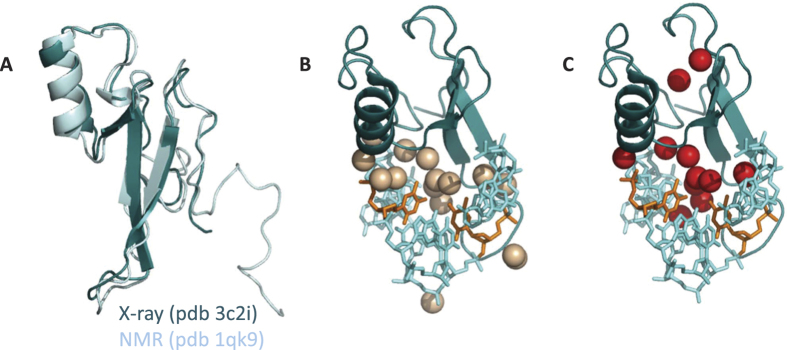
Figure 5. Conformational and hydration contributions to the MBD-dsDNA interaction.
(A) Structural alignment of the structure of MBD in solution determined by NMR and the structure of MBD bound to mCpG-dsDNA determined by X-ray crystallography. (B) Network of hydrogen-bonding water molecules trapped in the MBD-dsDNA interaction interface. Water molecules at less than 4 Å simultaneously from both MBD and dsDNA are shown as spheres. Methyl-cytidines are shown in orange. (C) Buried hydrogen-bonding water molecules in the MBD-dsDNA complex. Water molecules with less than 2 Å2 of SASA are shown as spheres (SASA values were calculated with Surface Racer70). Most of the water molecules shown are completely buried (SASA = 0 Å2). Methyl-cytidines are shown in orange.

