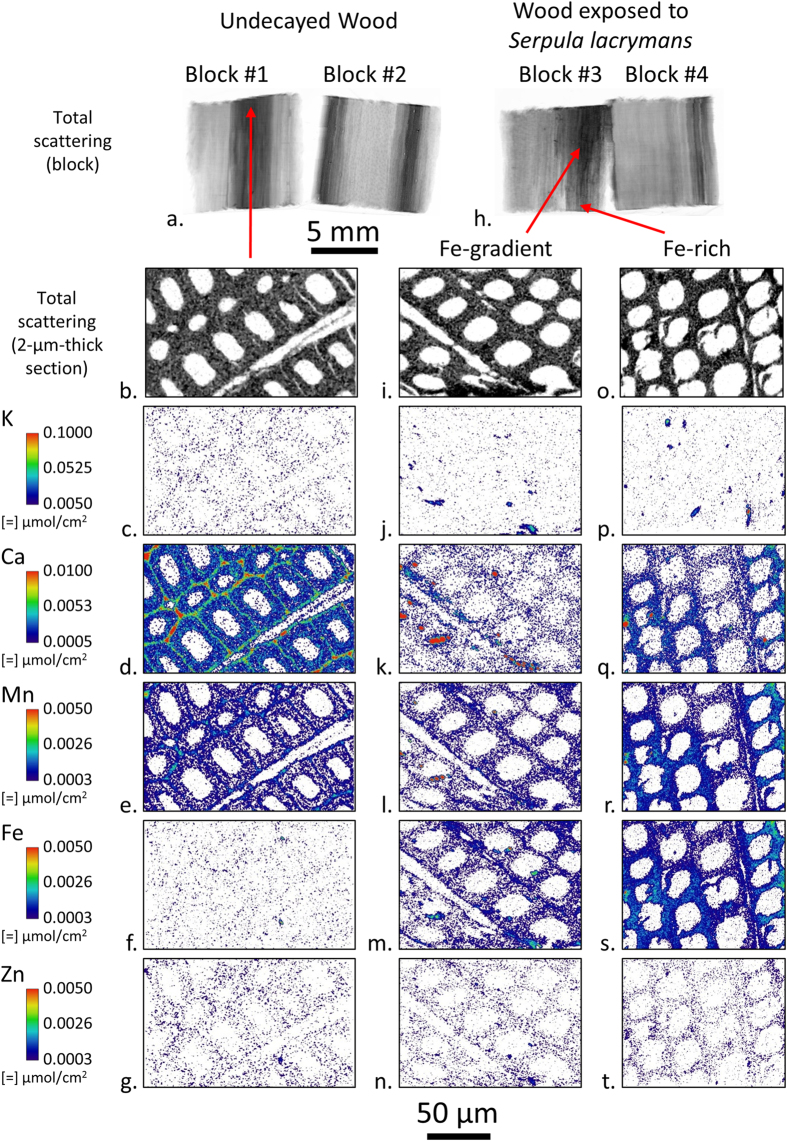
Figure 3. Submicron resolution XFM ion maps of 2-μm-thick transverse sections cut from undecayed wood Block 1 and exposed Block 3 in Fig. 1.
For a given element, the intensities were scaled the same between sections. Between elements, intensities were scaled to optimize ion distribution visualization.

