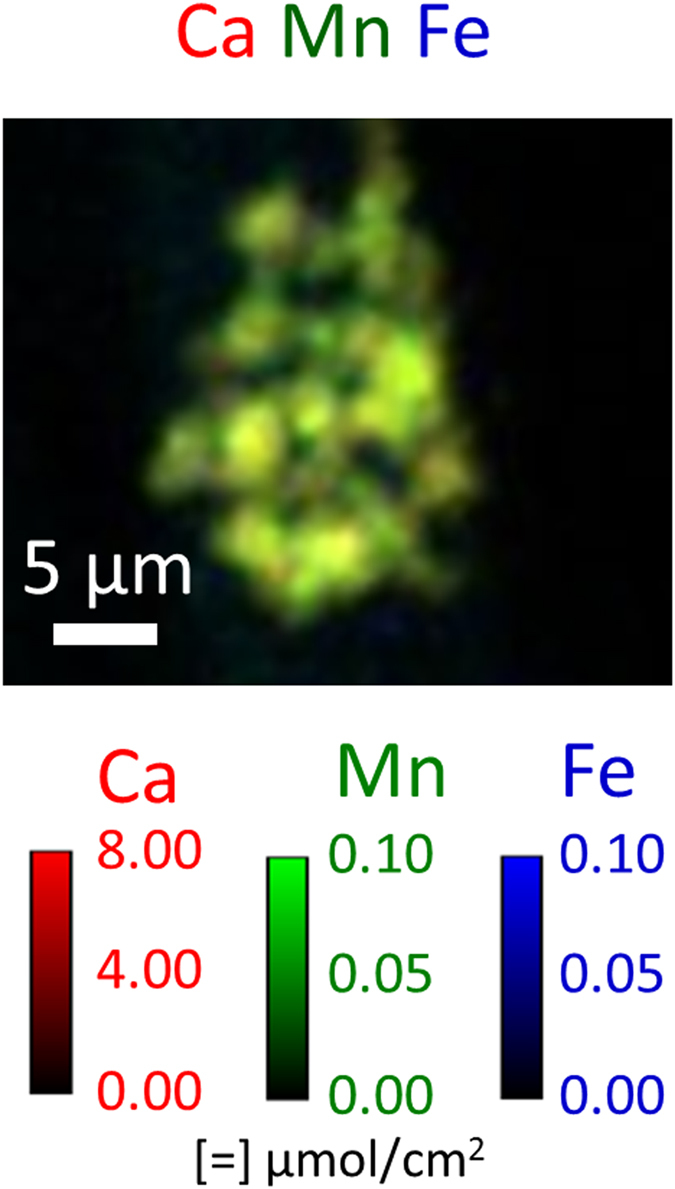
Figure 8. Ca Mn Fe 2D ion colocation map from an ion concentration of putative dried ECM attached near the bottom of the wood sliver (Fig. 7).

Color intensities were scaled to optimize spatial visualization of ion distribution within the structure containing the hotspot, and not the ions inside the wood cell wall.
