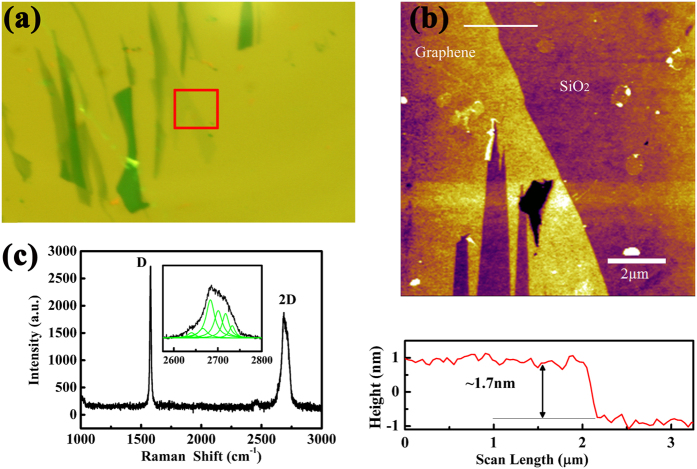
Figure 1.
(a) Optical microscopy image, (b) AFM topographic image with cross-sectional height profile below, and (c) Raman spectra of the pristine graphene nanosheets. The red solid box in (a) is the location of topography imaging. The white solid line in (b) indicates the location where the cross-sectional profile is taken. The inset in (c) is the Lorenz multi-peaks fitting results from 2D peak in Raman spectra.

