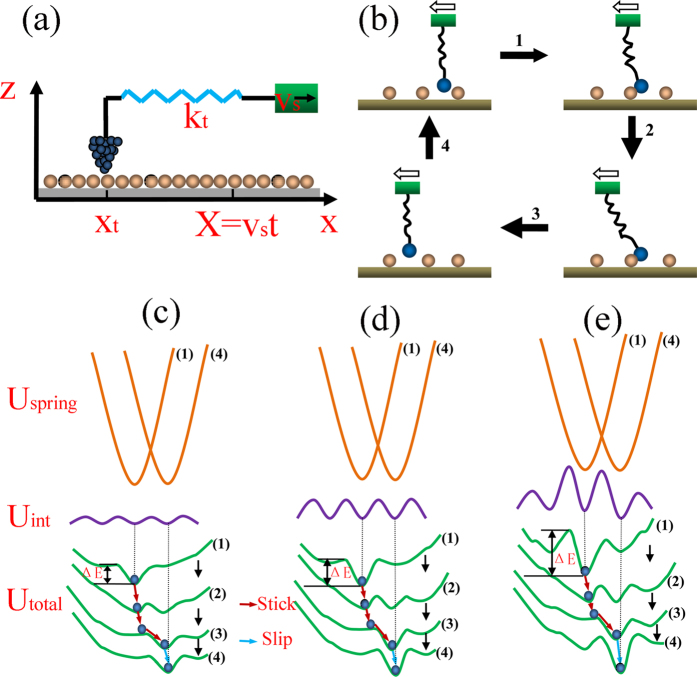
Figure 12.
(a) FFM test system model. (b) The description of the movement of the tip in a atomic lattice period. The hollow arrows represent the sliding direction of the tip. (c–e) The variation of the potential and the tip atomic trajectory correspond to (b). Where (c,d) depict the weak and strong tip-surface interaction potential respectively, (e) depicts the tip-surface interaction potential affected by structural defects and (1–4) denote the time evolution of the potential by the tip scan. The fluctuation of Uint in (e) results from the structural defects. The brown solid lines represent the deformation energy of the spring (Uspring), the purple solid lines represent the tip-surface interaction potential (Uint), and the green solid lines represent the total potential energy of the system (Utotal). The blue dots are the locations of the tip atom in the total potential energy and ΔE is the potential barrier.

