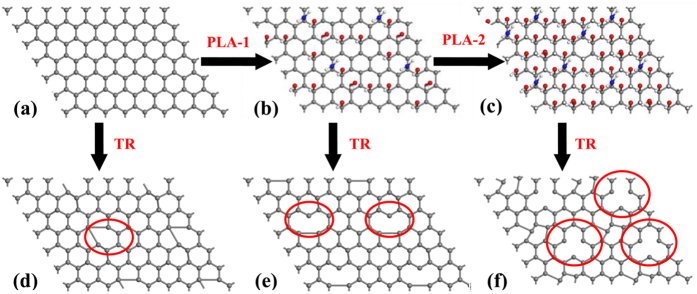
Figure 6.
(a–c) Schematic illustrating the variation of surface functional groups after plasma treatment for 0 s, 1 s and 2 s respectively. (d–f) Schematic illustrating the variation of surface functional groups and structural defects after thermal reduction corresponds to (a–c). The gray ball, red ball, white ball and blue ball represent C atom, O atom, H atom and N atom respectively. TR and PLA represent thermal reduction and plasma treatment respectively. The number of balls denotes the degree of the change of surface properties. The areas circled by red ellipse are the location of part structural defects. Surface functional groups are removed and partial structural defects are created by thermal reduction.

