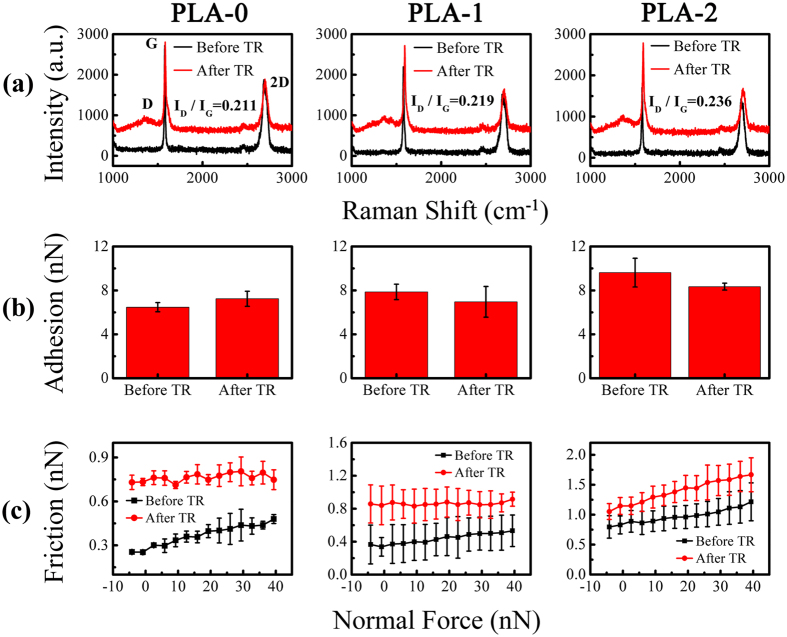
Figure 8.
(a) Raman spectra of the plasma-treated graphene nanosheets before and after thermal reduction. (b) The comparison of adhesion force of the plasma-treated graphene nanosheets between before and after thermal reduction. (c) The comparison of friction force of the plasma-treated graphene nanosheets between before and after thermal reduction. Where PLA and TR represent plasma treatment and thermal reduction respectively, The numbers after PLA represent the plasma treatment time (s).

