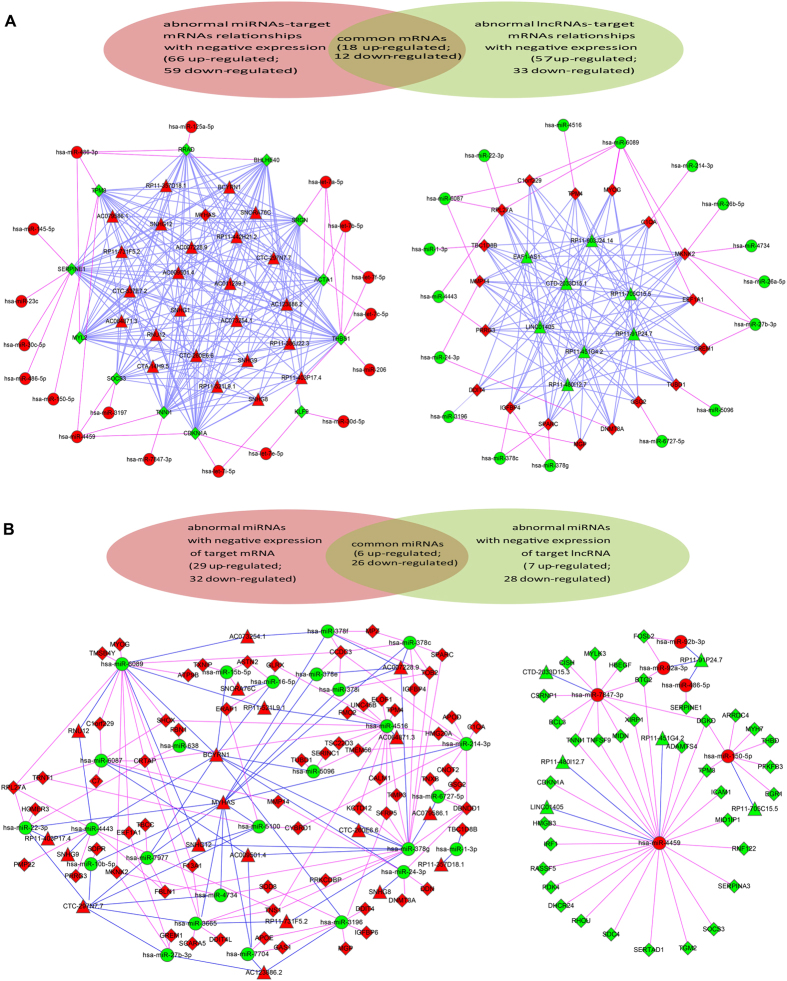
Figure 3.
The mtDNA A3243G-regulated miRNA-mRNA-lncRNA (A) and lncRNA-miRNA-mRNA (B) networks in muscle biopsies of MELAS. Numbers of target mRNAs (A) or miRNAs (B) in common or specifically in comparison are depicted in venn diagrams, which correspond to the Supplementary Table S4. For the network, circular node represent miRNA, diamond node represent mRNA and triangle node represent lncRNA. Color variations of the nodes and lines represent the following: red node, up-regulated RNA; green node, down-regulated RNA; pink line, miRNA-mRNA network; blue line, miRNA- or mRNA- lncRNA network.

