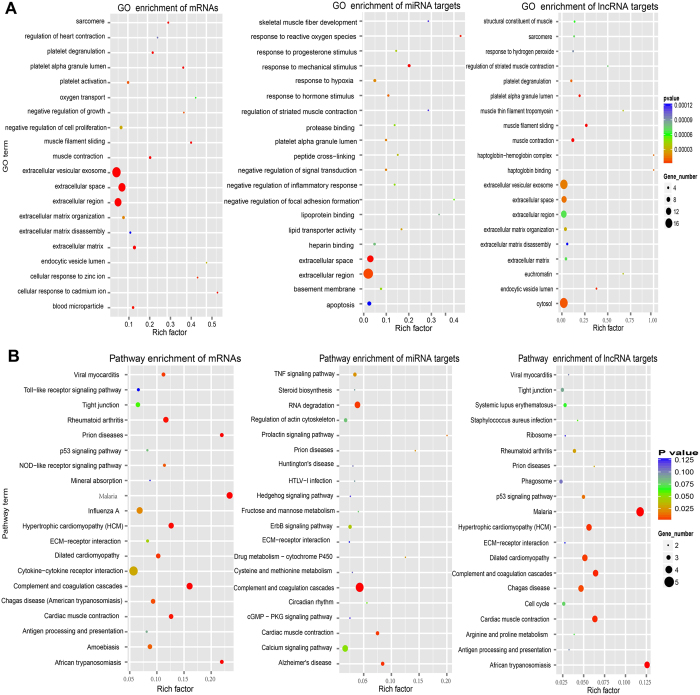
Figure 4.
Scatterplots of significant enrichment items of GO analyses (A) and pathway analyses (B) associated with abnormally expressed mRNAs, miRNA targets, lncRNA targets in muscle biopsies between MELAS patients and controls. The vertical axis is the GO or pathway term, and the horizontal axis is rich factor of GO or pathway enrichment. The P value denotes the significance of the GO or pathway item (the recommend cut-off of P value is 0.05).

