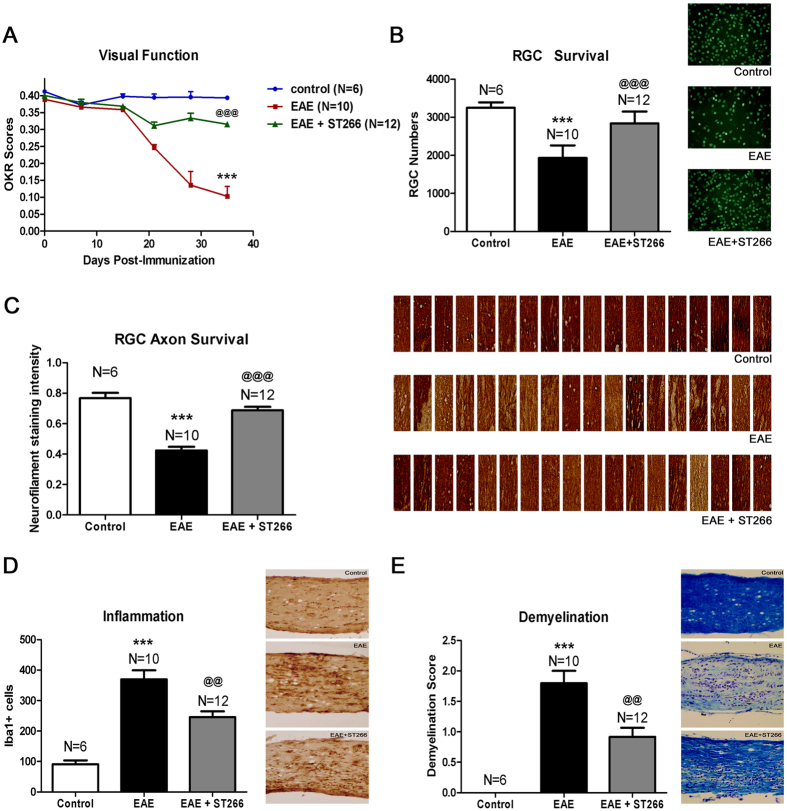
Figure 2. Prophylactic intranasal ST266 treatment suppresses EAE optic neuritis.
EAE mice were treated with one drop (6 μl) of PBS or ST266 in the nose daily beginning on the day of immunization through the day of sacrifice 6 weeks later. Control (non-EAE) mice received daily intranasal PBS. (A) Visual function, measured by OKR responses, shows significant decreases in eyes of EAE mice (N = 10) compared to controls (N = 6) (***p < 0.001), and daily intranasal ST266 leads to significantly better OKR responses in EAE mice (N = 12) (@@@p < 0.001 vs EAE). (B) RGCs/retina were counted 42 days post-immunization. EAE optic neuritis induces significant RGC loss (***p < 0.001 vs. control), and ST266 prevents this loss (@@@p < 0.001 vs. EAE). Images show RGCs (green) in one representative retinal field from each group (original magnification X40). (C) Optical density of RGC axon staining in longitudinal optic nerve sections shows significant RGC axon loss in EAE (***p < 0.001 vs. control) that is attenuated by ST266 (@@@p < 0.001 vs. EAE). Photographs of axon staining (brown) in three regions from 6 optic nerves from each treatment group highlight the focal nature of axonal degeneration. (D) Macrophages/microglia in optic nerves were immunostained using anti-Iba1 antibodies. Optic nerves from EAE mice have more Iba1+ cells than control mouse optic nerves (***p < 0.001), and inflammatory cell numbers are reduced in optic nerves from ST266-treated mice (@@p < 0.01 vs. EAE). Images show Iba1+ cells (brown) in one representative optic nerve from each group (original magnification X20). (E) Myelin in optic nerves stained with LFB shows EAE mice have more myelin loss than control mouse optic nerves (***p < 0.001), and demyelination is reduced in optic nerves from mice treated with ST266 (@@p < 0.01 vs EAE). Images show myelin stain (blue) in one representative optic nerve from each group (original magnification X20). Data represent the mean ± SEM in all graphs.

