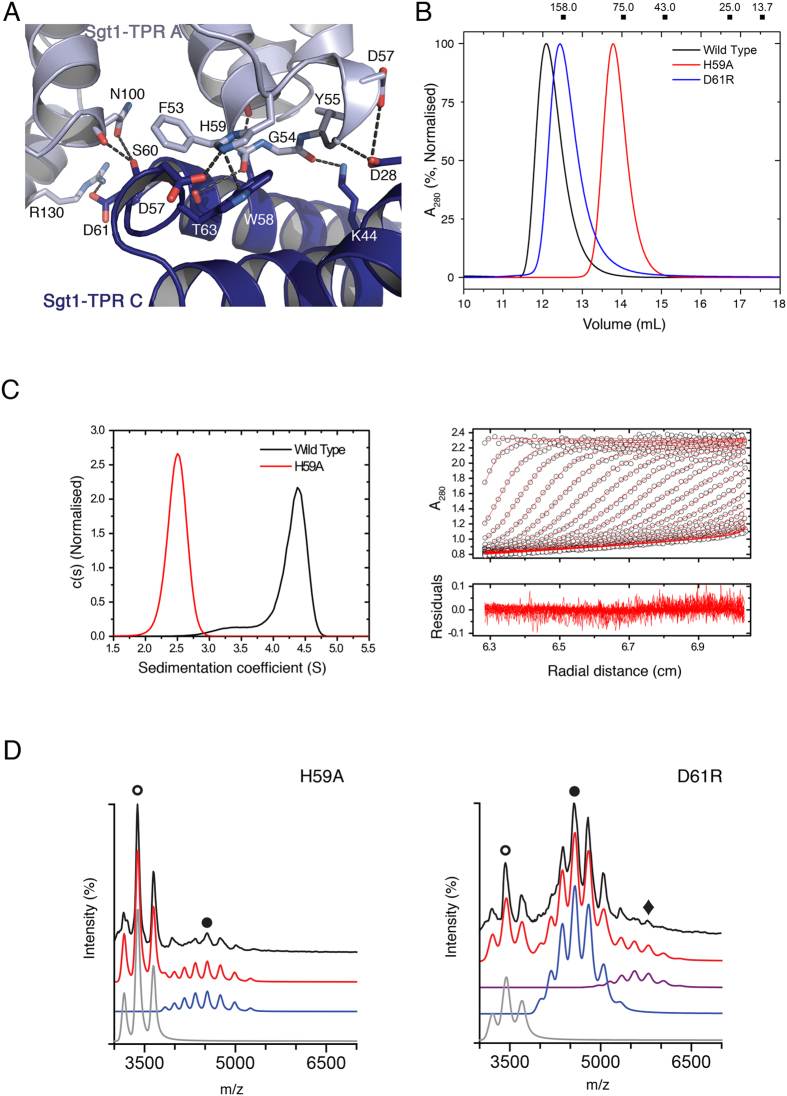
Figure 5. The Sgt1 Dimerization Interface.
(A) A detailed view of the oligomerization interface of Sgt1TPR. Residues that make the closest van der Waals contacts and hydrogen bonds are shown. (B) Size exclusion chromatography of full-length wild-type Sgt1 and the mutants H59A and D61R at 22.3 μM. Molecular weight standards for the column are shown above the chromatograph. (C) The c(s) distribution for full-length His6-tagged WT and H59A Sgt1 at 11.2 μM in SV-AUC and corresponding boundary fits and residuals for the H59A mutant. (D) Native nESI-MS spectra of the full-length Sgt1 H59A and D61R mutants. Charge states: monomer + 14 ○; dimer + 20 ●; trimer + 24 ♦. Data were deconvoluted with Amphitrite34 and are represented directly below each spectrum. The raw data are shown in black and the sum of simulated spectra in red. Charge state series corresponding to monomer, dimer, and trimer are indicated in grey, blue and purple respectively. Supplementary Table S2 details the percentage contribution of individual species at each concentration.

