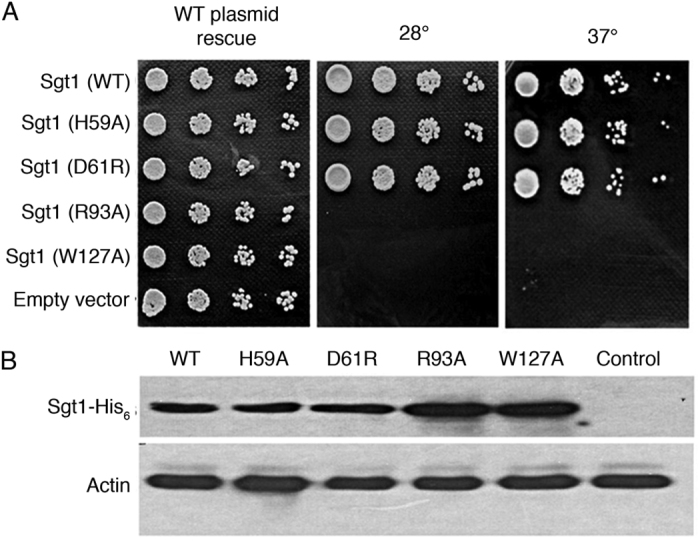
Figure 6. Yeast genetic analysis.

(A) Growth of S. cerevisiae JJ345 cells expressing wild-type (WT) Sgt1 or indicated mutants. Overnight 28 °C SD-Trp cultures were serially diluted, then pinned onto SD-Trp agar and photographed after 2 days of growth at 28 °C and 37 °C. (B) Analysis of Sgt1 level in 28 °C SD-Trp cultures expressing WT Sgt1 and either WT or mutant Sgt1-His6. Actin was measured as a loading control. Full-length blots are presented in Supplementary Figure S6B.
